

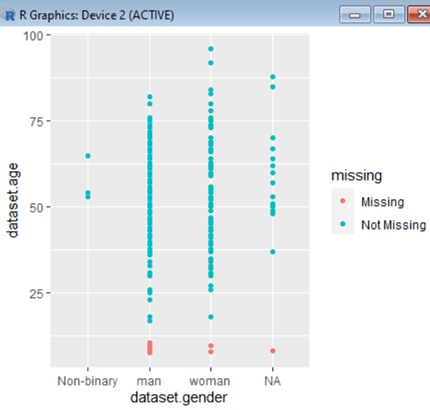
Question: dataset.age 25- RR Graphics: Device 2 (ACTIVE) 100- 75- 50 missing Missing Not Missing Non-binary man woman dataset.gender M- NA X dataset.age 25- 50
![150 minutes/week- Missing Not Missing names (even_smaller_dataset) [1] "dataset.age" "dataset. PHQ9_total" "dataset.BMI"](https://s3.amazonaws.com/si.experts.images/answers/2024/05/6647efa969f7e_4416647efa95765e.jpg)
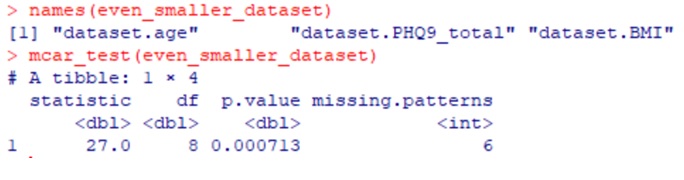
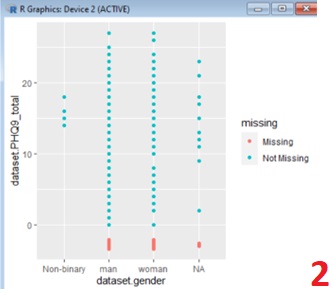
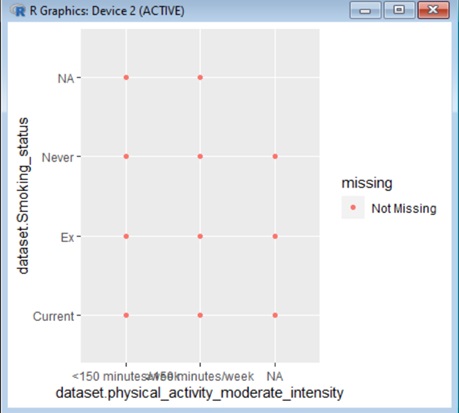
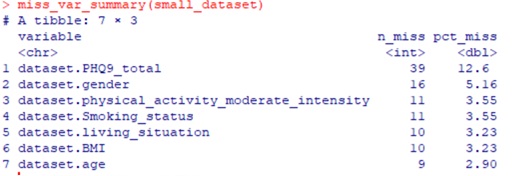
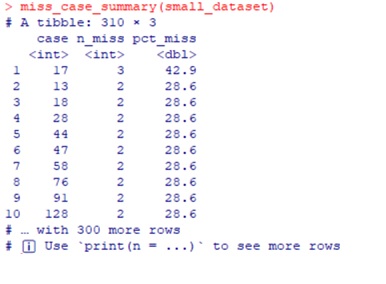
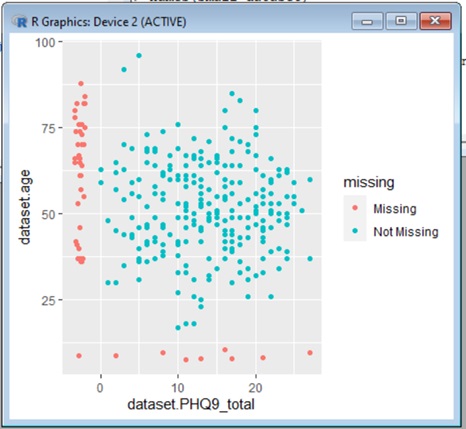
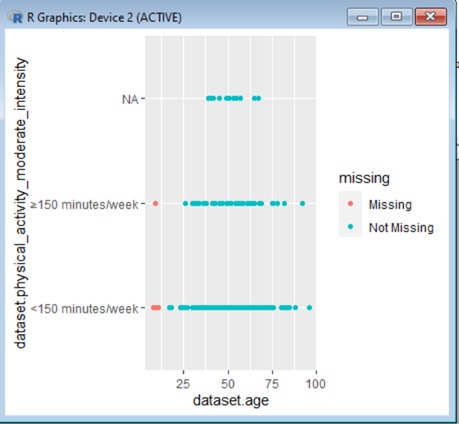
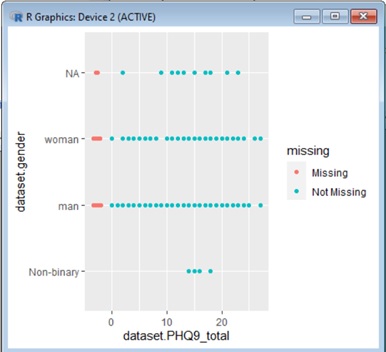
dataset.age 25- RR Graphics: Device 2 (ACTIVE) 100- 75- 50 missing Missing Not Missing Non-binary man woman dataset.gender M- NA X dataset.age 25- 50 RR Graphics: Device 2 (ACTIVE) 100- 75- ::. 10 20 dataset.PHQ9_total missing Missing Not Missing x RR Graphics: Device 2 (ACTIVE) dataset.physical_activity_moderate_intensity NA- missing 150 minutes/week- Missing Not Missing names (even_smaller_dataset) [1] "dataset.age" "dataset. PHQ9_total" "dataset.BMI" > mcar_test (even_smaller_dataset) %A tibble: 1 x 4 statistic df p.value missing.patterns 1 27.0 8 0.000713 6 dataset PHQ9 total 0- 10 RR Graphics: Device 2 (ACTIVE) 20 missing Missing Not Missing Non-binary man woman NA dataset gender 2 dataset.Smoking status RR Graphics: Device 2 (ACTIVE) NA- Never- missing Not Missing Ex- Current- miss_var_summary (small_dataset) # A tibble: 7 x 3 variable 1 dataset. PHQ9_total 2 dataset.gender 3 dataset.physical_activity_moderate_intensity 4 dataset. Smoking status 5 dataset.living_situation 6 dataset.BMI 7 dataset.age n_miss pct miss 39 12.6 16 5.16 11 3.55 11 3.55 10 3.23 10 3.23 9 2.90 > miss_case_summary (small_dataset) A tibble: 310 3 case n_miss pct miss 123 17 3 42.9 13 18 4 28 5 44 6 47 7 58 8 76 2222222 28.6 28.6 28.6 28.6 28.6 28.6 28.6 9 91 2 28.6 10 128 2 28.6 with 300 more rows Use 'print (n =...) to see more rows
Step by Step Solution
There are 3 Steps involved in it

Get step-by-step solutions from verified subject matter experts