

Question: Date Adj Close Price P n : SPY Adj Close Price P n : TLT 5/31/2017 235.858 120.4887 6/30/2017 237.3616 121.4428 7/31/2017 242.2404 120.6433 8/31/2017
Date Adj Close Price Pn: SPY Adj Close Price Pn: TLT 5/31/2017 235.858 120.4887 6/30/2017 237.3616 121.4428 7/31/2017 242.2404 120.6433 8/31/2017 242.9471 124.7557 9/29/2017 247.8424 121.8577 10/31/2017 253.6826 121.8107 11/30/2017 261.4366 122.716 12/29/2017 264.6073 124.9404 1/31/2018 279.5203 120.8728 2/28/2018 269.3568 117.1966 3/29/2018 261.9736 120.548 4/30/2018 263.3276 118.0308 5/31/2018 269.7288 120.3966 6/29/2018 271.28 121.1741 7/31/2018 281.33 119.433
Using the monthly returns, find the values of the following inferences about SPY and TLT, respectively.
- AAR
- GAR
- HPR
- Standard deviation
- Sharpe ratio
- VaR (1%) and Var (5%)
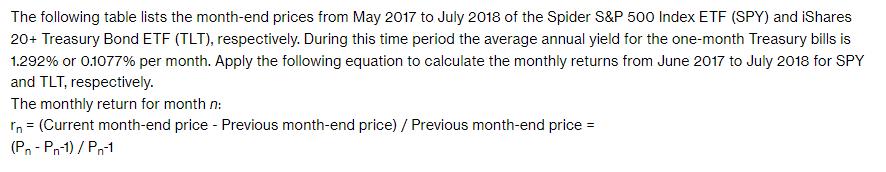
The following table lists the month-end prices from May 2017 to July 2018 of the Spider S&P 500 Index ETF (SPY) and iShares 20+ Treasury Bond ETF (TLT), respectively. During this time period the average annual yield for the one-month Treasury bills is 1.292% or 0.1077% per month. Apply the following equation to calculate the monthly returns from June 2017 to July 2018 for SPY and TLT, respectively. The monthly return for month n: rn = (Current month-end price - Previous month-end price) / Previous month-end price = (Pn-Pn-1)/Pn-1
Step by Step Solution
3.44 Rating (151 Votes )
There are 3 Steps involved in it
ANSWER To calculate the monthly returns ... View full answer

Get step-by-step solutions from verified subject matter experts