

Question: Date FTSE 100 / Return EXPERIAN/ Return GLAXOSMITHKLINE / Return 02/03/2018 -4.304 -4.731 0.150 02/04/2018 0.099 1.119 8.062 02/05/2018 7.322 9.854 4.735 02/06/2018 2.649 10.124
| Date | FTSE 100 / Return | EXPERIAN/ Return | GLAXOSMITHKLINE / Return |
| 02/03/2018 | -4.304 | -4.731 | 0.150 |
| 02/04/2018 | 0.099 | 1.119 | 8.062 |
| 02/05/2018 | 7.322 | 9.854 | 4.735 |
| 02/06/2018 | 2.649 | 10.124 | 5.643 |
| 02/07/2018 | -1.692 | 1.563 | -0.368 |
| 02/08/2018 | 0.459 | -0.965 | 1.107 |
| 02/09/2018 | -0.160 | 4.602 | 4.533 |
| 02/10/2018 | -0.262 | 1.812 | -2.903 |
| 02/11/2018 | -4.833 | -10.371 | -3.809 |
| 02/12/2018 | 0.016 | 10.606 | 2.447 |
| 02/01/2019 | -4.531 | -3.411 | 0.160 |
| 02/02/2019 | 4.303 | 4.393 | -1.133 |
| 02/03/2019 | 2.000 | 0.819 | 3.343 |
| 02/04/2019 | 4.406 | 7.637 | 5.998 |
| 02/05/2019 | -0.072 | 3.819 | -3.348 |
| 02/06/2019 | -1.729 | 9.038 | 1.344 |
| 02/07/2019 | 5.498 | 2.732 | 4.583 |
| 02/08/2019 | -1.935 | 1.599 | 4.370 |
| 02/09/2019 | -0.743 | 4.640 | 3.879 |
| 02/10/2019 | -2.019 | -4.511 | -3.846 |
| 02/11/2019 | 2.832 | -2.301 | 5.449 |
| 02/12/2019 | 0.219 | 4.422 | -0.617 |
| 02/01/2020 | 4.496 | 1.345 | 2.681 |
| 02/02/2020 | -3.620 | 4.902 | 1.328 |
| 02/03/2020 | -8.471 | 1.196 | -8.223 |
| 02/04/2020 | -17.511 | -19.099 | -8.393 |
| 02/05/2020 | 5.311 | 7.306 | 7.902 |
| 02/06/2020 | 8.327 | 20.000 | 3.631 |
| 02/07/2020 | 0.533 | 3.342 | -0.061 |
| 02/08/2020 | -3.191 | -3.949 | -3.892 |
| 02/09/2020 | -0.905 | 2.272 | -4.931 |
| 02/10/2020 | -0.473 | 4.055 | -2.995 |
| 02/11/2020 | -4.095 | -3.152 | -8.293 |
| 02/12/2020 | 14.639 | -6.437 | 6.575 |
| 02/01/2021 | 0.131 | 3.852 | -3.703 |
| 02/02/2021 | 0.904 | -1.934 | 1.937 |
| 02/03/2021 | 1.884 | -14.707 | -9.997 |
| 02/04/2021 | 2.493 | 10.025 | 5.692 |
| 02/05/2021 | 3.714 | 9.662 | 4.853 |
| 02/06/2021 | 2.307 | -2.186 | 1.412 |
| 02/07/2021 | 0.424 | 5.629 | 7.314 |
| 02/08/2021 | -0.457 | 12.303 | -0.709 |
| 02/09/2021 | 2.170 | 1.214 | 4.702 |
| 02/10/2021 | -1.800 | -4.428 | -6.137 |
| 02/11/2021 | 3.603 | 9.009 | 12.919 |
| 02/12/2021 | -1.660 | 2.066 | -0.724 |
| 02/01/2022 | 3.675 | 5.031 | 4.733 |
| 02/02/2022 | 2.729 | -11.589 | 2.701 |
| 02/03/2022 | -1.638 | -6.781 | -4.613 |
| 02/04/2022 | 2.114 | -2.414 | 6.864 |
| 02/05/2022 | 0.459 | -4.087 | 8.475 |
| 02/06/2022 | 0.259 | -8.023 | -4.195 |
| 02/07/2022 | -4.719 | -4.174 | 4.556 |
| 02/08/2022 | 3.479 | 17.489 | -6.020 |
| 02/09/2022 | -0.817 | -8.196 | -19.311 |
| 02/10/2022 | -5.003 | 1.716 | -2.396 |
| 02/11/2022 | 3.487 | 0.751 | 9.548 |
| 02/12/2022 | 6.164 | 10.462 | -0.494 |
| 02/01/2023 | -1.289 | -5.192 | 0.955 |
| 02/02/2023 | 4.999 | 12.885 | -0.709 |
| Mean Monthly Return | 0.503 | 1.544 | 0.713 |
| Standard Deviation | 4.459792934 | 7.419710246 | 5.609850488 |
| covariance | 15.2664611 | 15.39160272 | 11.95766115 |
| Correlation | 0.461356597 | 0.369781869 | 0.477947573 |
Risk-free rate is 0.1
[Write no more than 2 pages in total for this question]
a. Compute and present the betas of your stocks to the FTSE-100. Explain how you have estimated them. 5 marks
b. Discuss what your estimated betas imply for the amount of market risk that these stocks carry and also what they imply for the relationship between returns on the FTSE-100 and returns on the stocks. Compare the magnitudes of your stocks estimated betas to those on the risk-free asset and the market portfolio, respectively, as part of your discussion. 5 marks
c. Use the betas you have estimated and the CAPM to estimate the required return on these stocks. Use the FTSE-100 to proxy for the market portfolio. Interpret the relative size of these required returns in terms of the risk that the stocks carry. 5 marks
d. Compute the levels of systematic and idiosyncratic risk for your stocks. Interpret your results.
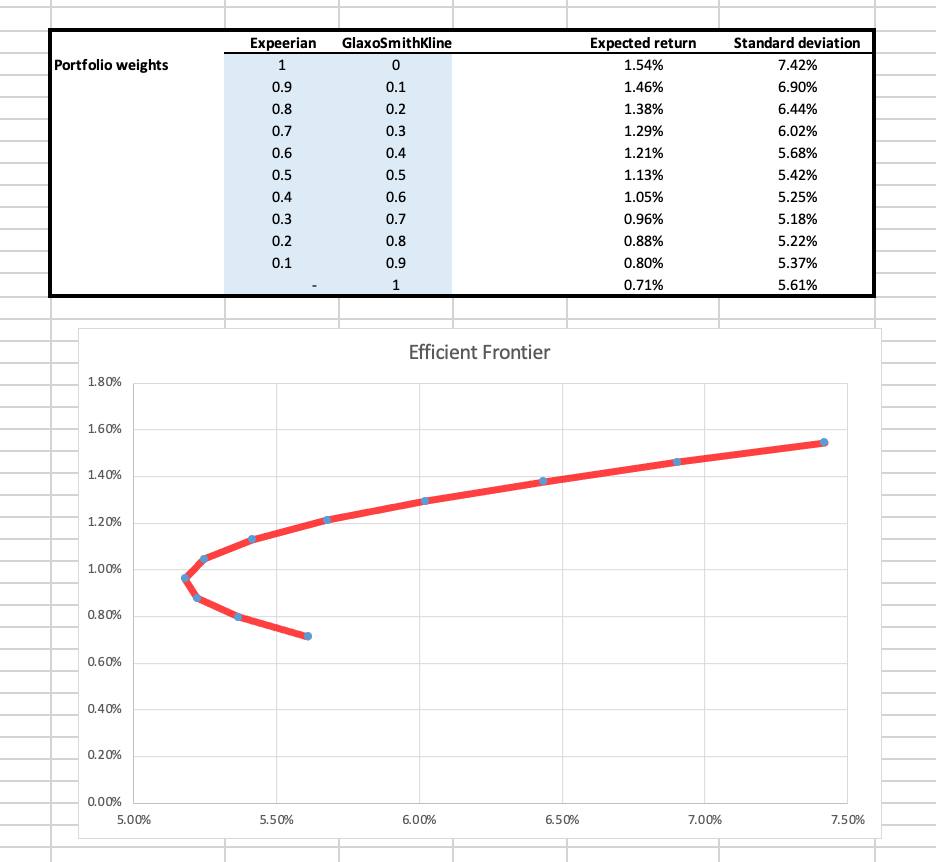
\begin{tabular}{|lcccc|} \hline & Expeerian & GlaxoSmithKline & Expected return & Standard deviation \\ \cline { 2 - 5 } Portfolio weights & 1 & 0 & 1.54% & 7.42% \\ & 0.9 & 0.1 & 1.46% & 6.90% \\ & 0.8 & 0.2 & 1.38% & 6.44% \\ & 0.7 & 0.3 & 1.29% & 6.02% \\ & 0.6 & 0.4 & 1.21% & 5.68% \\ & 0.5 & 0.5 & 1.13% & 5.42% \\ & 0.4 & 0.6 & 1.05% & 5.25% \\ & 0.3 & 0.7 & 0.96% & 5.18% \\ & 0.2 & 0.8 & 0.88% & 5.22% \\ & 0.1 & 0.9 & 0.80% & 5.37% \\ & & 1 & 0.71% & 5.61% \\ \hline \end{tabular} Efficient Frontier 1.80% 1.60% 1.40% 1.20% 1.00% 0.80% 0.60% 0.40% 0.20% 0.00% \begin{tabular}{|lcccc|} \hline & Expeerian & GlaxoSmithKline & Expected return & Standard deviation \\ \cline { 2 - 5 } Portfolio weights & 1 & 0 & 1.54% & 7.42% \\ & 0.9 & 0.1 & 1.46% & 6.90% \\ & 0.8 & 0.2 & 1.38% & 6.44% \\ & 0.7 & 0.3 & 1.29% & 6.02% \\ & 0.6 & 0.4 & 1.21% & 5.68% \\ & 0.5 & 0.5 & 1.13% & 5.42% \\ & 0.4 & 0.6 & 1.05% & 5.25% \\ & 0.3 & 0.7 & 0.96% & 5.18% \\ & 0.2 & 0.8 & 0.88% & 5.22% \\ & 0.1 & 0.9 & 0.80% & 5.37% \\ & & 1 & 0.71% & 5.61% \\ \hline \end{tabular} Efficient Frontier 1.80% 1.60% 1.40% 1.20% 1.00% 0.80% 0.60% 0.40% 0.20% 0.00%
Step by Step Solution
There are 3 Steps involved in it

Get step-by-step solutions from verified subject matter experts