

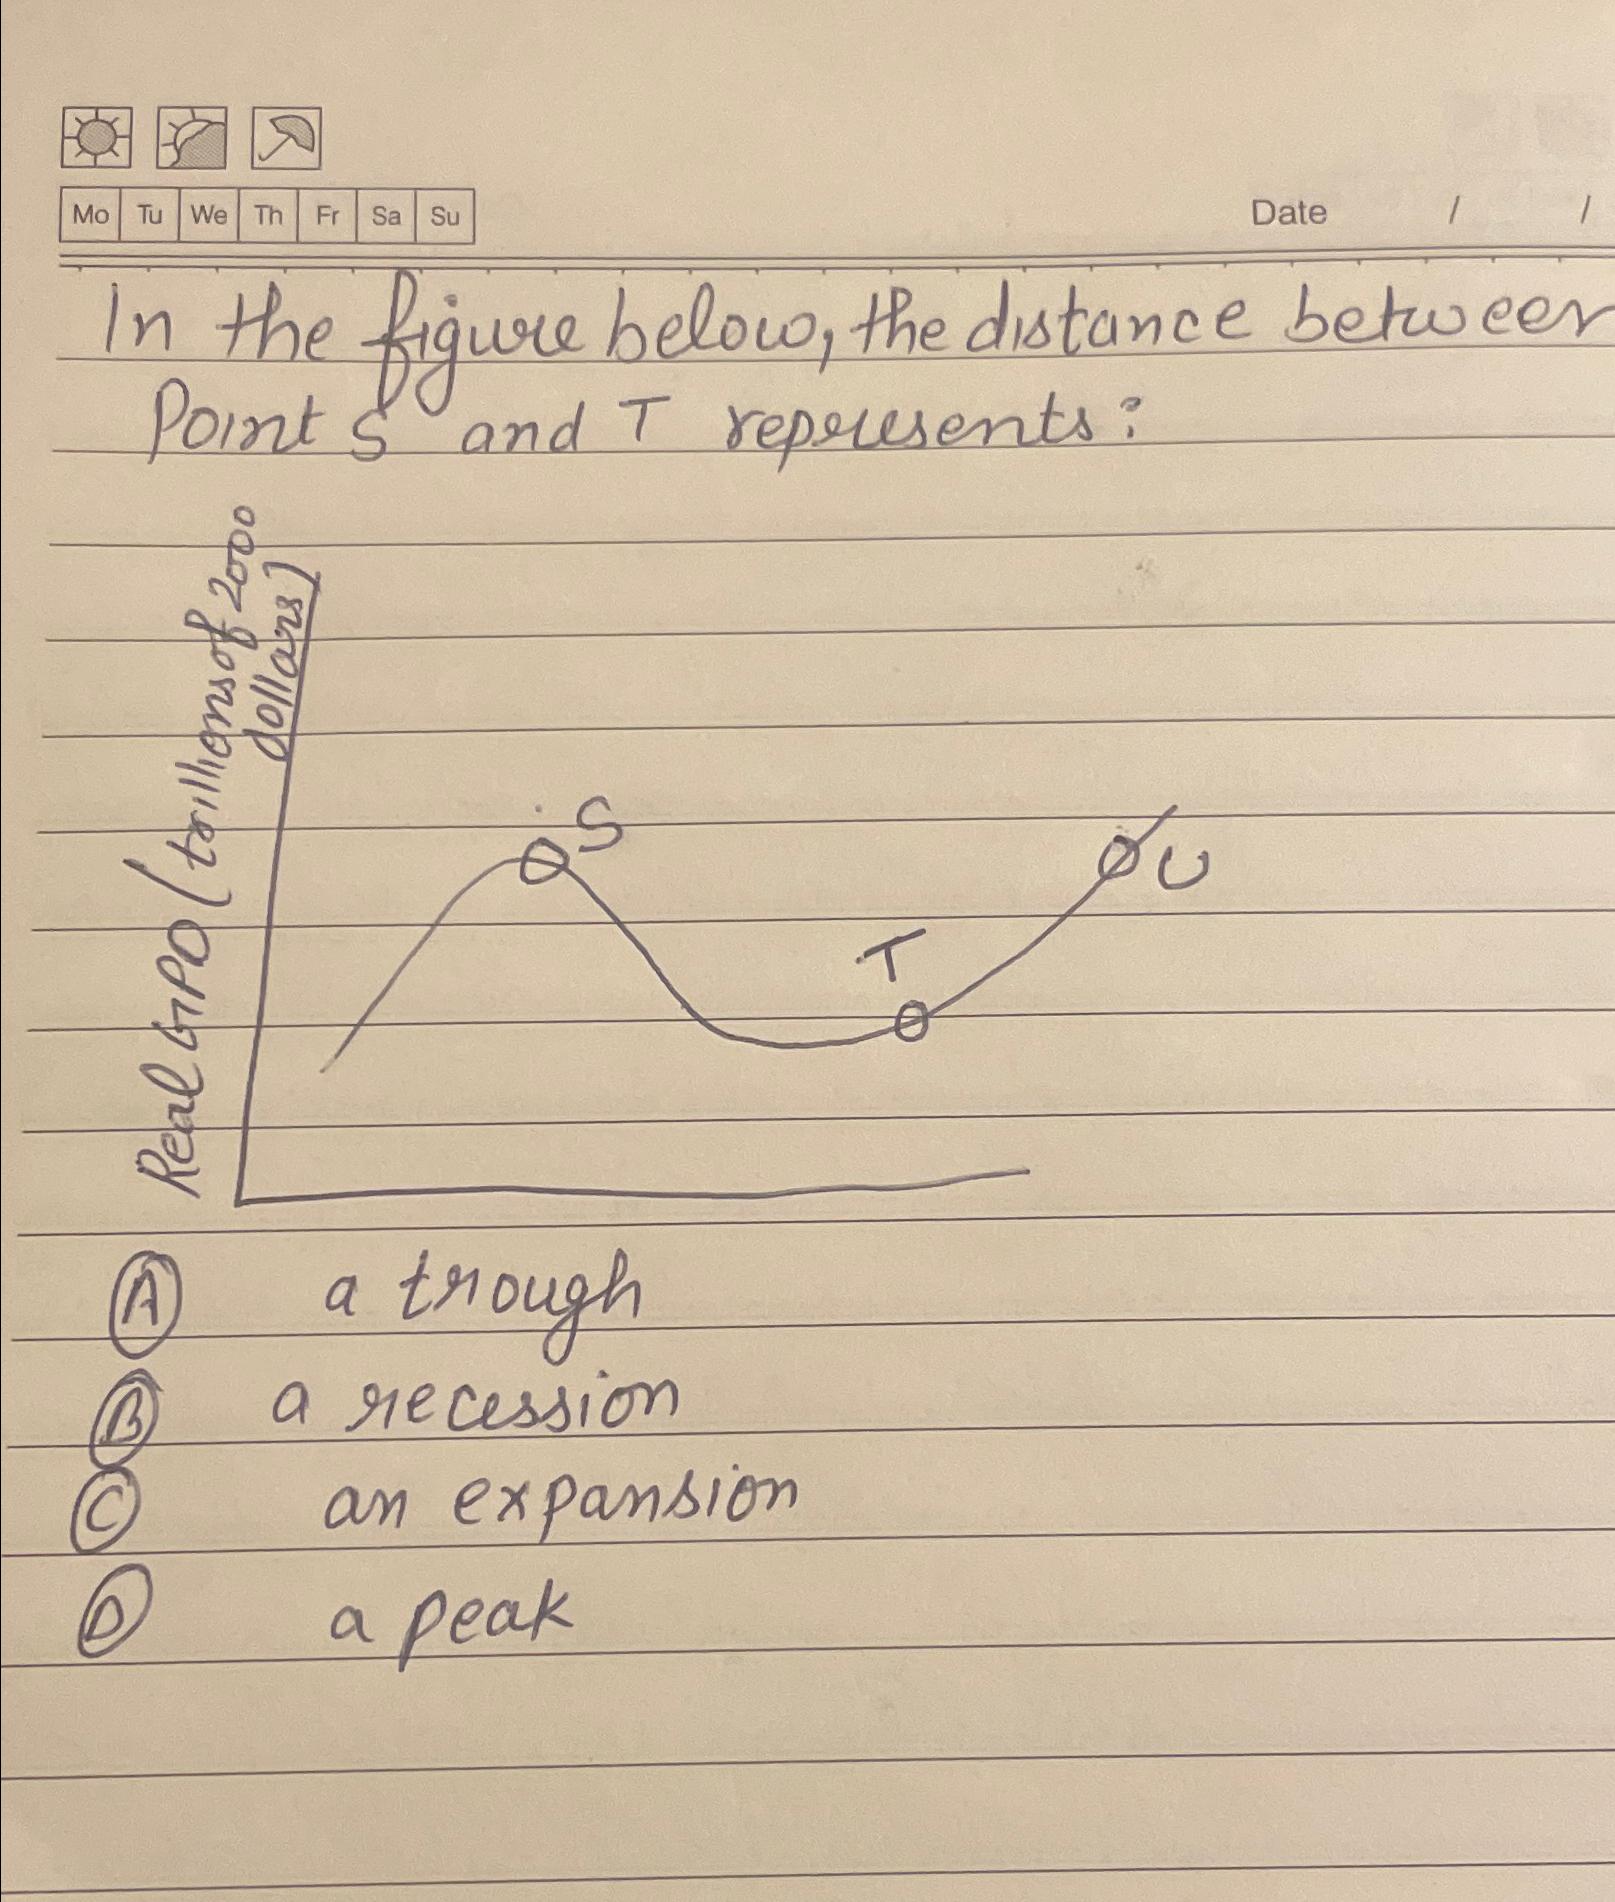
Question: Date In the figure below, the distance between point S and T represents: ( A ) a trough ( B ) a recession ( c
Date
In the figure below, the distance between point and represents:
A a trough
B a recession
c an expansion
a peak
Step by Step Solution
There are 3 Steps involved in it
1 Expert Approved Answer
Step: 1 Unlock

Question Has Been Solved by an Expert!
Get step-by-step solutions from verified subject matter experts
Step: 2 Unlock
Step: 3 Unlock