

Question: Date Open High Low Close Adj Close Volume 6/30/16 null null null null null null 7/31/16 75.669998 80.690002 71.809998 75.690002 71.212059 6606842 8/31/16 75.089996 75.580002
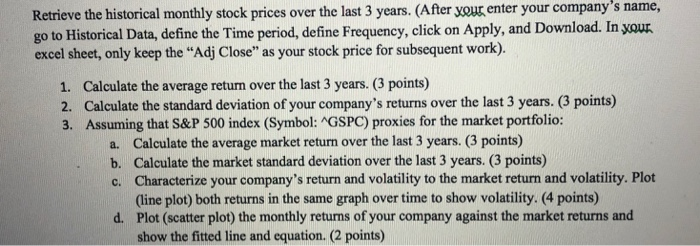
Retrieve the historical monthly stock prices over the last 3 years. (After your enter your company's name, go to Historical Data, define the Time period, define Frequency, click on Apply, and Download. In your excel sheet, only keep the "Adj Close" as your stock price for subsequent work). 1. Calculate the average return over the last 3 years. (3 points) 2. Calculate the standard deviation of your company's returns over the last 3 years. (3 points) 3. Assuming that S&P 500 index (Symbol: GSPC) proxies for the market portfolio: a. Calculate the average market return over the last 3 years. (3 points) b. Calculate the market standard deviation over the last 3 years. (3 points) c. Characterize your company's return and volatility to the market return and volatility. Plot (line plot) both returns in the same graph over time to show volatility. (4 points) d. Plot (scatter plot) the monthly returns of your company against the market returns and show the fitted line and equation. (2 points)
Step by Step Solution
There are 3 Steps involved in it

Get step-by-step solutions from verified subject matter experts