

Question: Date Open High Low Close* Adj Close** Volume Mar 01, 2018 2,715.22 2,801.90 2,585.89 2,640.87 2,640.87 76,349,800,000 Feb 01, 2018 2,816.45 2,835.96 2,532.69 2,713.83 2,713.83
Date Open High Low Close* Adj Close** Volume Mar 01, 2018 2,715.22 2,801.90 2,585.89 2,640.87 2,640.87 76,349,800,000 Feb 01, 2018 2,816.45 2,835.96 2,532.69 2,713.83 2,713.83 79,579,410,000 Jan 01, 2018 2,683.73 2,872.87 2,682.36 2,823.81 2,823.81 76,860,120,000 Dec 01, 2017 2,645.10 2,694.97 2,605.52 2,673.61 2,673.61 65,251,190,000 Nov 01, 2017 2,583.21 2,657.74 2,557.45 2,584.84 2,584.84 95,142,800,000 Oct 01, 2017 2,521.20 2,582.98 2,520.40 2,575.26 2,575.26 70,871,570,000 Sep 01, 2017 2,474.42 2,519.44 2,446.55 2,519.36 2,519.36 66,337,980,000 Aug 01, 2017 2,477.10 2,490.87 2,417.35 2,471.65 2,471.65 70,616,030,000 Jul 01, 2017 2,431.39 2,484.04 2,407.70 2,470.30 2,470.30 63,169,400,000 Jun 01, 2017 2,415.65 2,453.82 2,405.70 2,423.41 2,423.41 81,002,490,000 May 01, 2017 2,388.50 2,418.71 2,352.72 2,411.80 2,411.80 79,607,170,000 Apr 01, 2017 2,362.34 2,398.16 2,328.95 2,384.20 2,384.20 65,265,670,000 Mar 01, 2017 2,380.13 2,400.98 2,322.25 2,362.72 2,362.72 81,547,770,000 Feb 01, 2017 2,285.59 2,371.54 2,271.65 2,363.64 2,363.64 69,162,420,000 Jan 01, 2017 2,251.57 2,300.99 2,245.13 2,278.87 2,278.87 70,483,180,000 Dec 01, 2016 2,200.17 2,277.53 2,187.44 2,238.83 2,238.83 75,251,240,000 Nov 01, 2016 2,128.68 2,214.10 2,083.79 2,198.81 2,198.81 88,299,760,000 Oct 01, 2016 2,164.33 2,169.60 2,114.72 2,126.15 2,126.15 73,196,630,000 Sep 01, 2016 2,171.33 2,187.87 2,119.12 2,168.27 2,168.27 77,270,240,000 Aug 01, 2016 2,173.15 2,193.81 2,147.58 2,170.95 2,170.95 75,610,310,000 Jul 01, 2016 2,099.34 2,177.09 2,074.02 2,173.60 2,173.60 69,530,250,000 Jun 01, 2016 2,093.94 2,120.55 1,991.68 2,098.86 2,098.86 86,852,700,000 May 01, 2016 2,067.17 2,103.48 2,025.91 2,096.95 2,096.95 78,883,600,000 Apr 01, 2016 2,056.62 2,111.05 2,033.80 2,065.30 2,065.30 81,124,990,000 Mar 01, 2016 1,937.09 2,072.21 1,937.09 2,059.74 2,059.74 92,639,420,000 Feb 01, 2016 1,936.94 1,962.96 1,810.10 1,932.23 1,932.23 93,049,560,000 Jan 01, 2016 2,038.20 2,038.20 1,812.29 1,940.24 1,940.24 92,409,770,000 Dec 01, 2015 - - - - - - *Close price adjusted for splits.**Adjusted close price adjusted for both dividends and splits.
I need to know how to calculate a, b, c, and d please.
Here is the missing information
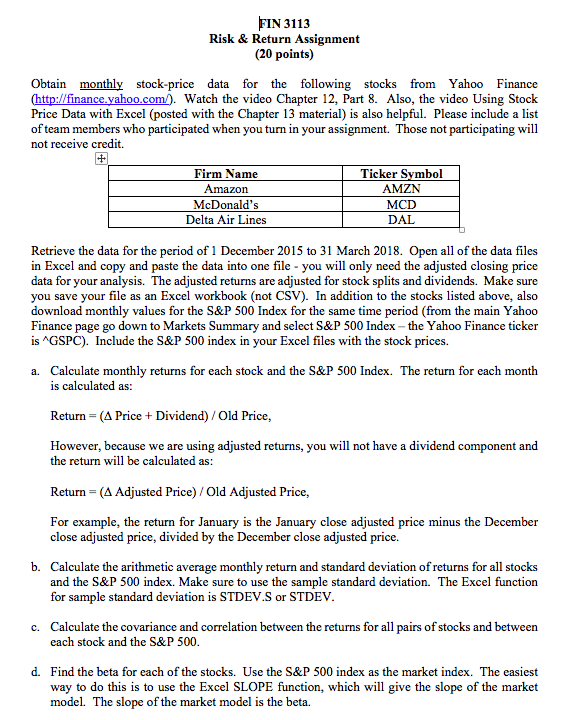
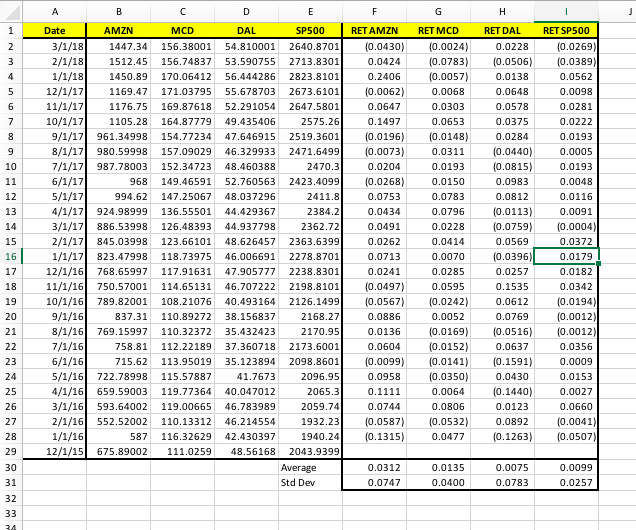
FIN 3113 Risk & Return Assignment (20 points) Obtain monthly stock-price data for the following stocks from Yahoo Finance Chttp://finance.yahoo.com). Watch the video Chapter 12, Part 8. Also, the video Using Stock Price Data with Excel (posted with the Chapter 13 material) is also helpful. Please include a list of team members who participated when you turn in your assignment. Those not participating will not receive credit. firm Name Amazorn McDonald's Delta Air Lines Ticker Svmbol AMZN MCD DAL Retrieve the data for the period of 1 December 2015 to 31 March 2018. Open all of the data files in Excel and copy and paste the data into one file you will only need the adjusted closing price data for your analysis. The adjusted returns are adjusted for stock splits and dividends. Make sure you save your file as an Excel workbook (not CSV). In addition to the stocks listed above, also download monthly values for the S&P 500 Index for the same time period (from the main Yahoo Finance page go down to Markets Summary and select S&P 500 Index -the Yahoo Finance ticker is ^GSPC). Include the S&P 500 index in your Excel files with the stock prices. Calculate monthly returns for each stock and the S&P 500 Index. The return for each month is calculated as: a. Return - (A Price + Dividend) / Old Price, However, because we are using adjusted returns, you will not have a dividend component and the return will be calculated as Return - (A Adjusted Price) / Old Adjusted Price, For example, the return for January is the January close adjusted price minus the December close adjusted price, divided by the December close adjusted price. b. Calculate the arithmetic average monthly return and standard deviation of returns for all stocks and the S&P 500 index. Make sure to use the sample standard deviation. The Excel function for sample standard deviation is STDEV.S or STDEV Calculate the covariance and correlation between the returns for all pairs of stocks and between each stock and the S&P 500 c. d. Find the beta for each of the stocks. Use the S&P 500 index as the market index. The easiest way to do this is to use the Excel SLOPE function, which will give the slope of the market model. The slope of the market model is the beta. FIN 3113 Risk & Return Assignment (20 points) Obtain monthly stock-price data for the following stocks from Yahoo Finance Chttp://finance.yahoo.com). Watch the video Chapter 12, Part 8. Also, the video Using Stock Price Data with Excel (posted with the Chapter 13 material) is also helpful. Please include a list of team members who participated when you turn in your assignment. Those not participating will not receive credit. firm Name Amazorn McDonald's Delta Air Lines Ticker Svmbol AMZN MCD DAL Retrieve the data for the period of 1 December 2015 to 31 March 2018. Open all of the data files in Excel and copy and paste the data into one file you will only need the adjusted closing price data for your analysis. The adjusted returns are adjusted for stock splits and dividends. Make sure you save your file as an Excel workbook (not CSV). In addition to the stocks listed above, also download monthly values for the S&P 500 Index for the same time period (from the main Yahoo Finance page go down to Markets Summary and select S&P 500 Index -the Yahoo Finance ticker is ^GSPC). Include the S&P 500 index in your Excel files with the stock prices. Calculate monthly returns for each stock and the S&P 500 Index. The return for each month is calculated as: a. Return - (A Price + Dividend) / Old Price, However, because we are using adjusted returns, you will not have a dividend component and the return will be calculated as Return - (A Adjusted Price) / Old Adjusted Price, For example, the return for January is the January close adjusted price minus the December close adjusted price, divided by the December close adjusted price. b. Calculate the arithmetic average monthly return and standard deviation of returns for all stocks and the S&P 500 index. Make sure to use the sample standard deviation. The Excel function for sample standard deviation is STDEV.S or STDEV Calculate the covariance and correlation between the returns for all pairs of stocks and between each stock and the S&P 500 c. d. Find the beta for each of the stocks. Use the S&P 500 index as the market index. The easiest way to do this is to use the Excel SLOPE function, which will give the slope of the market model. The slope of the market model is the beta
Step by Step Solution
There are 3 Steps involved in it

Get step-by-step solutions from verified subject matter experts