

Question: day & date time kWh reading kWh used hours elapsed avg. kW used day & date time kWh reading kWh used hours elapsed avg.
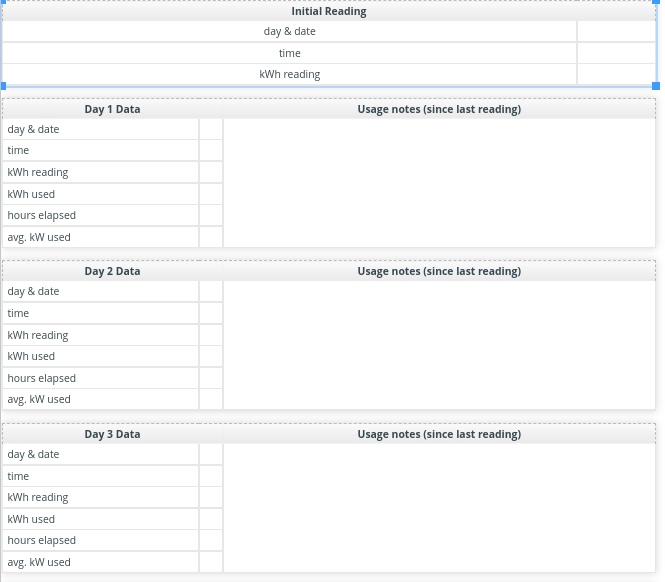
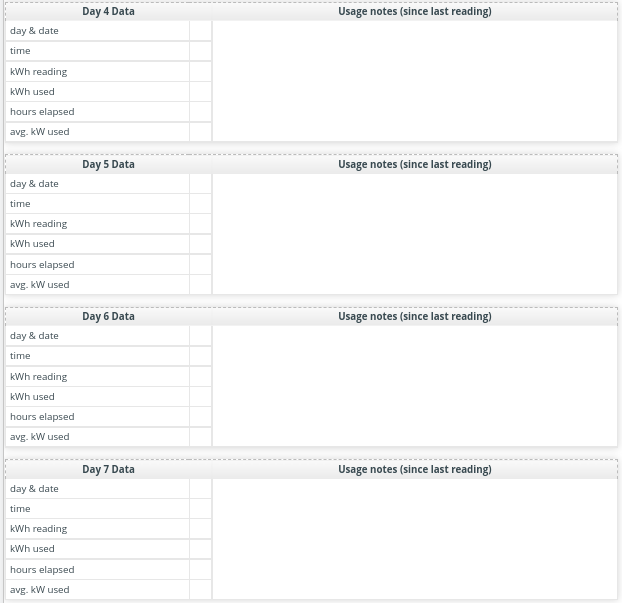
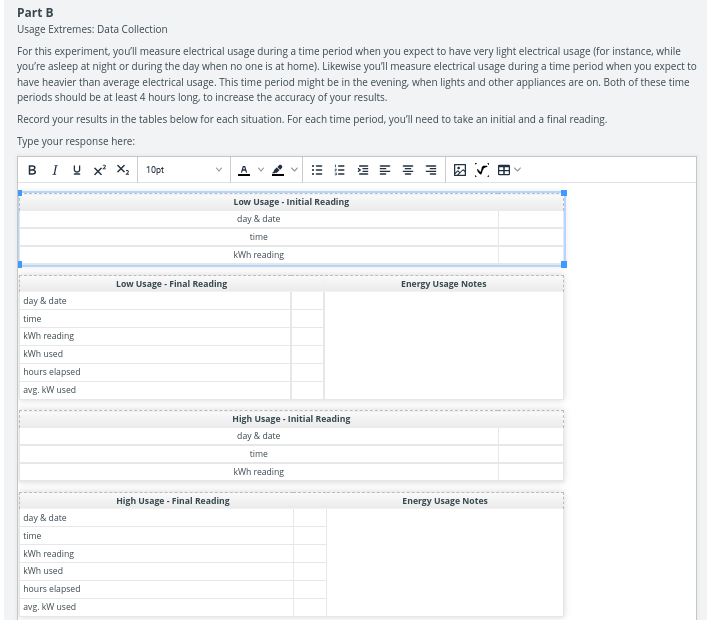
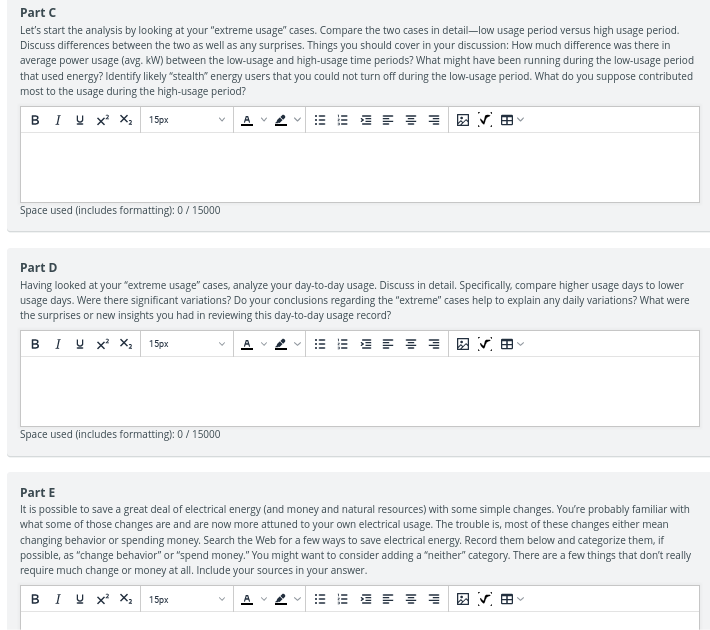
day & date time kWh reading kWh used hours elapsed avg. kW used day & date time kWh reading kWh used hours elapsed avg. kW used day & date time kWh reading kWh used hours elapsed avg. kW used Day 1 Data Day 2 Data Day 3 Data Initial Reading day & date time kWh reading Usage notes (since last reading) Usage notes (since last reading) Usage notes (since last reading) day & date time kWh reading kWh used hours elapsed avg. kW used day & date time kWh reading kWh used hours elapsed avg. kW used day & date time kWh reading kWh used hours elapsed avg. kW used day & date time kWh reading kWh used hours elapsed avg. kW used Day 4 Data Usage notes (since last reading) Day 5 Data Usage notes (since last reading) Day 6 Data Day 7 Data Usage notes (since last reading) Usage notes (since last reading) Part B Usage Extremes: Data Collection For this experiment, you'll measure electrical usage during a time period when you expect to have very light electrical usage (for instance, while you're asleep at night or during the day when no one is at home). Likewise you'll measure electrical usage during a time period when you expect to have heavier than average electrical usage. This time period might be in the evening, when lights and other appliances are on. Both of these time periods should be at least 4 hours long, to increase the accuracy of your results. Record your results in the tables below for each situation. For each time period, you'll need to take an initial and a final reading. Type your response here: BIXX 10pt Low Usage - Initial Reading day & date time kWh reading Low Usage - Final Reading day & date time kWh reading kWh used hours elapsed avg. kW used High Usage - Initial Reading day & date time kWh reading High Usage - Final Reading day & date time kWh reading kWh used hours elapsed avg. kW used Energy Usage Notes Energy Usage Notes Part C Let's start the analysis by looking at your "extreme usage" cases. Compare the two cases in detail-low usage period versus high usage period. Discuss differences between the two as well as any surprises. Things you should cover in your discussion: How much difference was there in average power usage (avg. kW) between the low-usage and high-usage time periods? What might have been running during the low-usage period that used energy? Identify likely "stealth" energy users that you could not turn off during the low-usage period. What do you suppose contributed most to the usage during the high-usage period? 15px = = = = = = Space used (includes formatting): 0/15000 Part D Having looked at your "extreme usage" cases, analyze your day-to-day usage. Discuss in detail. Specifically, compare higher usage days to lower usage days. Were there significant variations? Do your conclusions regarding the "extreme" cases help to explain any daily variations? What were the surprises or new insights you had in reviewing this day-to-day usage record? BIxx 15px = = = = Space used (includes formatting): 0/15000 Part E It is possible to save a great deal of electrical energy (and money and natural resources) with some simple changes. You're probably familiar with what some of those changes are and are now more attuned to your own electrical usage. The trouble is, most of these changes either mean changing behavior or spending money. Search the Web for a few ways to save electrical energy. Record them below and categorize them, if possible, as "change behavior" or "spend money." You might want to consider adding a "neither" category. There are a few things that don't really require much change or money at all. Include your sources in your answer. BIxx 15px v = = = = = = Part F Based on what you've learned from your household energy investigation, which of these methods seems reasonable to do in your own home this year? (Do you plan to do it?) Provide your rationale. BIU X x 15px Space used (includes formatting): 0/15000 Home Energy Use In this activity, you are going to perform an experiment to track the amount of power you and your family use, then look at some basic patterns in that usage. (NOTE: If you live in an apartment or home in which you do not have access to the electrical meter, consult with your instructor about alternative arrangements, like teaming with a classmate to gather this data.) This experiment is going to span the course of a full week and require 12 meter readings. It really involves two separate experiments: tracking daily energy use for a week to compare any usage variations from day to day comparing a single high-usage time period of a few hours with a single low-usage time period of a few hours to help you identify the extremes in your household electrical use You can easily do both experiments during the same time period. This approach would be the easiest and fastest way to proceed. Read the instructions for both Part A and Part B if you wish to do both experiments at the same time. To begin, you'll need to find your electric meter, which could be inside or outside of your home. Many electric meters these days are digital and pretty easy to read, but if you have an older "dial-type" meter, go to this electric meter reading guide to learn about how to read and understand it. For each of the two experiments below, you will first record three simple pieces of data in a table: 1) day and date, 2) time, and 3) the kWh reading from the meter. Then record the results of three simple calculations: kWh used: Calculate kWh used since the last reading (subtraction). Hours elapsed: Calculate the number of hours since the last reading (subtraction rounded to a whole number). Average kW used: (kWh used)/(hours elapsed). If this number turns out to be 0.36, for example, it means that your average household power usage for the time period was about 360 watts, the equivalent of running six 60-watt bulbs for that whole time period. Part A Daily Electrical Usage: Data Collection Pick a convenient time of day to take readings from your electric meter. You'll need readings roughly a day apart, but if they differ by only an hour or two, that should be fine. Pick a consistent time you'll remember, though, such as after getting home for the day. You need to start by doing an initial meter reading, then follow up with a reading every day for the next 7 days. You'll do 8 readings in all. Record your readings in the tables below. In addition to the data fields described above, there is a lot of room for usage notes. Record anything that might have substantially affected the electrical usage since your previous reading. This might include the amount of time people were around and awake at home, use of specific devices such as an air conditioner, clothes dryer, TV, or lighting. Type your response here:
Step by Step Solution
There are 3 Steps involved in it
Home Energy Use Experiment Part A Daily Electrical Usage Data Collection Instructions Record your el... View full answer

Get step-by-step solutions from verified subject matter experts