

Question: DDROP DOWN OPTIONS ON THE RIGHT PART ARE: STRONG OR WEAK. THANKS. Comprehensive Ratio Analysis The Jimenez Corporation's forecasted 2019 financial statements follow, along with
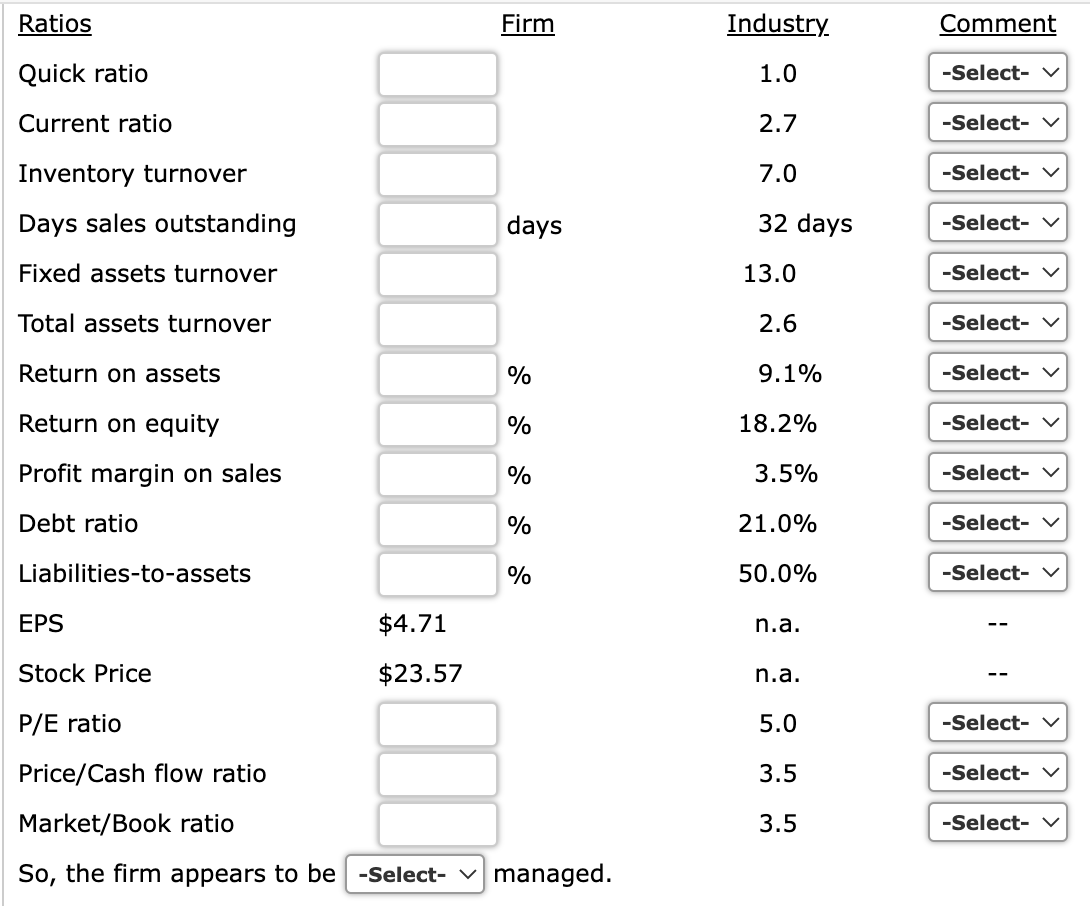 DDROP DOWN OPTIONS ON THE RIGHT PART ARE: STRONG OR WEAK. THANKS.
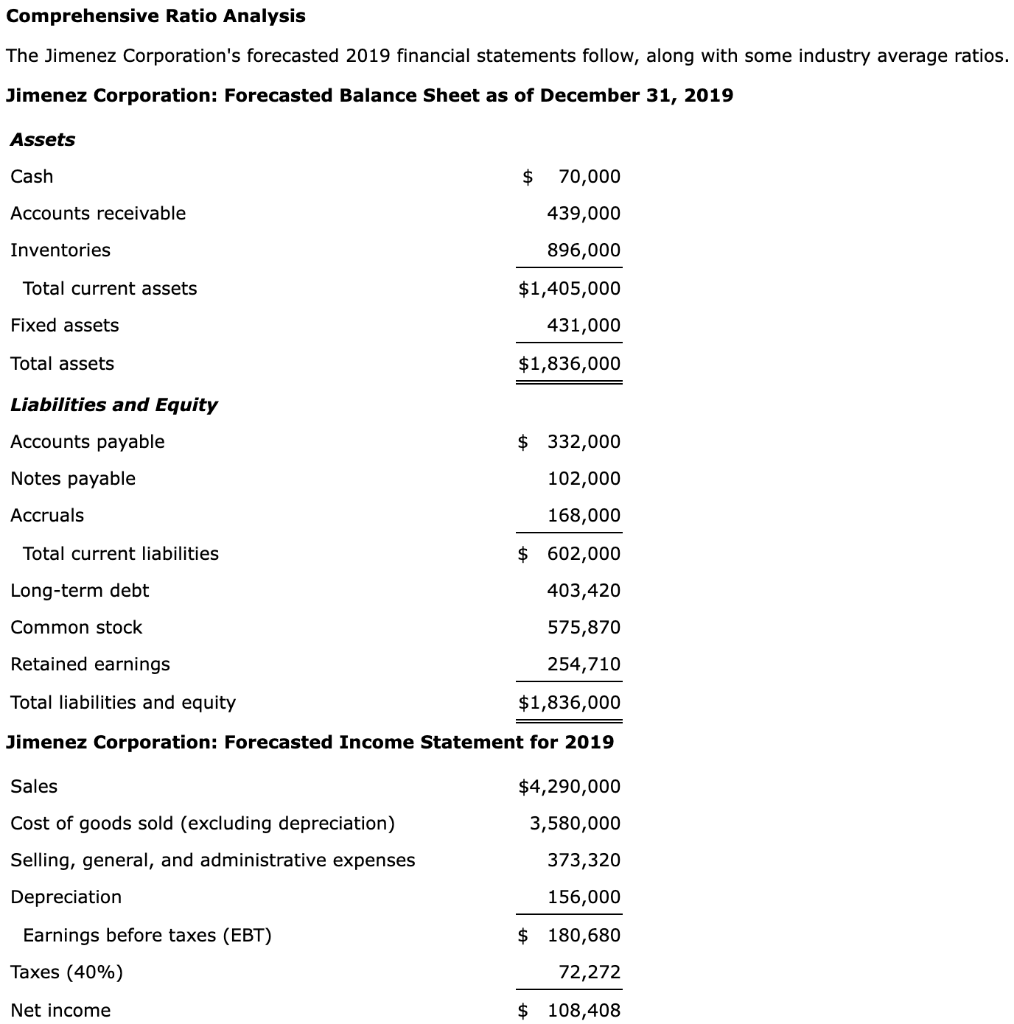
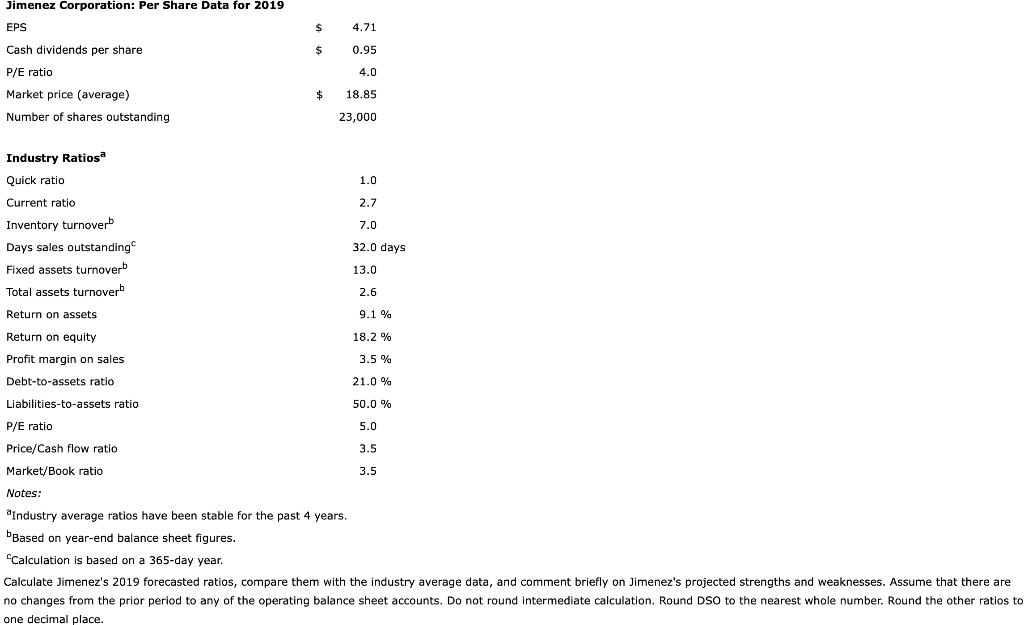
Comprehensive Ratio Analysis The Jimenez Corporation's forecasted 2019 financial statements follow, along with some industry average ratios. Jimenez Corporation: Forecasted Balance Sheet as of December 31, 2019 Assets Cash $ 70,000 Accounts receivable 439,000 Inventories 896,000 $1,405,000 Total current assets Fixed assets 431,000 Total assets $1,836,000 Liabilities and Equity $ 332,000 Accounts payable Notes payable 102,000 Accruals 168,000 Total current liabilities $ 602,000 Long-term debt 403,420 575,870 Common stock Retained earnings 254,710 Total liabilities and equity $1,836,000 Jimenez Corporation: Forecasted Income Statement for 2019 Sales Cost of goods sold (excluding depreciation) Selling, general, and administrative expenses Depreciation $4,290,000 3,580,000 373,320 156,000 Earnings before taxes (EBT) Taxes (40%) $ 180,680 72,272 Net income $ 108,408 Jimenez Corporation: Per Share Data for 2019 EPS $ 4.71 $ 0.95 4.0 Cash dividends per share P/E ratio Market price (average) Number of shares outstanding $ 18.85 23,000 1.0 2.7 Industry Ratiosa Quick ratio Current ratio Inventory turnover Days sales outstanding Fixed assets turnoverb Total assets turnoverb 7.0 32.0 days 13.0 2.6 Return on assets 9.1 % 18.2 % Return on equity Profit margin on sales 3.5 % Debt-to-assets ratio 21.0 % Liabilities-to-assets ratio 50.0 % P/E ratio 5.0 Price/Cash flow ratio 3.5 Market/Book ratio 3.5 Notes: : 'Industry average ratios have been stable for the past 4 years. Based on year-end balance sheet figures. Calculation is based on a 365-day year. Calculate Jimenez's 2019 forecasted ratios, compare them with the industry average data, and comment briefly on Jimenez's projected strengths and weaknesses. Assume that there are no changes from the prior period to any of the operating balance sheet accounts. Do not round intermediate calculation. Round DSO to the nearest whole number. Round the other ratios to one decimal place. Ratios Firm Industry Comment Quick ratio 1.0 -Select- v Current ratio 2.7 -Select- Inventory turnover 7.0 -Select- Days sales outstanding days 32 days -Select- v Fixed assets turnover 13.0 -Select- v Total assets turnover 2.6 -Select- Return on assets % 9.1% -Select- Return on equity % 18.2% -Select- Profit margin on sales % 3.5% -Select- v Debt ratio % 21.0% -Select- v Liabilities-to-assets % 50.0% -Select- v EPS $4.71 n.a. Stock Price $23.57 n.a. P/E ratio 5.0 -Select- v Price/Cash flow ratio 3.5 -Select- Market/Book ratio 3.5 -Select- v So, the firm appears to be -Select- v managed
Step by Step Solution
There are 3 Steps involved in it

Get step-by-step solutions from verified subject matter experts