

Question: de rt AI . X D 4 . You wethe Human Resources director for the company and you weinterested in their and compensation practices in

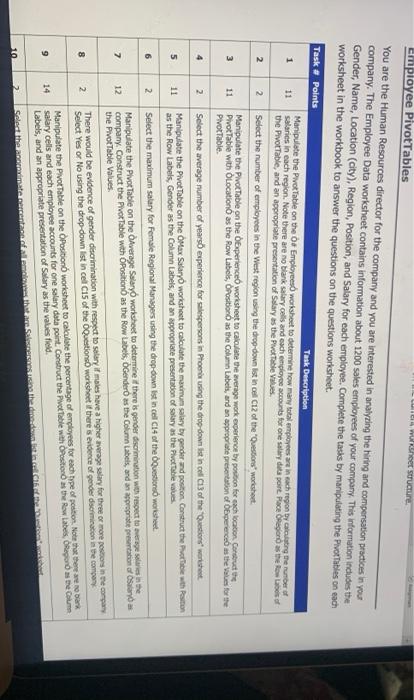
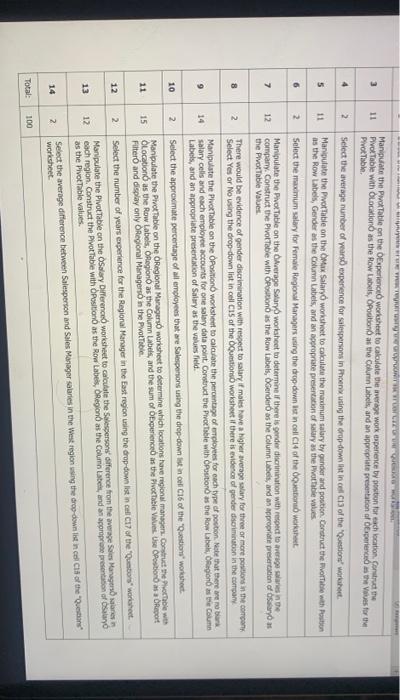
de rt AI . X D 4 . You wethe Human Resources director for the company and you weinterested in their and compensation practices in your company. The Employer Data worksheet contains information about 1200 sales employees of your company. This information includes the Gender, Location higien. Position and Salary for each lover Compite the tanks by maiting the Pivottables on each worksheet in the workbook to answer the question the time worksheet 9 30 11 Plect the cost to your wrom the drop down it for macht 14 35 16 12 Tash 2 Tack Tag Tank Task 10 Task 12 Tack 14 How many employees are in the West Region? What is the aver umber of years experience for sale in Phone? What is the maximum way for Female Region Managers? to the evidence of gender discrimination with respect to try? Appromately what percentage of employees weepersonal How many years orience does there and manage tapone? What is the differenc between the average for Sale and Manager in the West 20 21 22 24 25 26 27 25 29 30 31 12 33 10 35 36 37 38 40 Employee Data Salary once 42 Position Regional Managers Max Salary Atorage Salary Experience Questions Employees employee Pivot Tables Le weet structure You are the Human Resources director for the company and you are interested in analyzing the hiring and compensation practices in you company. The Employee Data worksheet contains information about 1200 sales employees of your company. This information includes the Gender, Name, Location (city), Region, Position, and Salary for each employee. Complete the tasks by manipulating the Pivot Taties on each worksheet in the workbook to answer the questions on the questions worksheet Task & Points Task Description Manipulate the Pivot Table on the Employees worksheet to determine how many total employees are in each region by calcatre ruber of 1 11 salaries in each region. Note there are no blank salary cells and each employee accounts for one stary data point. Pace Oreiro as the Roof the Pivot Table, and an appropriate presentation of Salary as the potable Values 2 2 Select the number of employees in the West region using the drop-down istinel 12 of the Questions worksheet Manipulate the Pivot Table on the experience worksheet to calculate the average work experience by position for each location Consulte 3 11 Pivot Table with location as the Row Labels, Position as the Column Labels, and an appropriate presentation of Experience as the values for the Pivot Table 4 2 Select the average number of years experience for salespersons in Phoenie using the drop down ist in cell C13 of the Questions weet Manipulate the Pivot Table on the Max Salary worksheet to calculate the maximum salary by gender and position Construct the Phil with stron as the Row Labels, Gender as the Column Labels, and an appropriate presentation of salary as the potable values 6 2 Select the maximum salary for Female Regional Managers using the drop-down list in cell C14 of the questions wortisht Manipulate the Pivot Table on the average Salary worksheet to determine there is pender discrimination with respect to average sales in the 7 12 company. Construct the Pivot Table with Position as the Row Labels, Ogender as the Column Labels, and an appropriate presentation of an the Pivot Table Values There would be evidence of gender discrimination with respect to salary if males have a higher verage salary for three or more possors ne company 8 2 Select Yes or No using the drop-down list in cell C15 of the Questions worksheet there is evidence of gender discrimination in the company Manipulate the Pivot Table on the Position worksheet to calculate the percentage of employees for each type of position. Note that there are no bar 9 salary cells and each employee accounts for one salary data point. Construct the Pivottable with Position as the Row Labes, Report as the com Labels, and an appropriate presentation of Salary as the values field. 10 Sched the treated mic thote Salses hadden 5 11 14 2 3 11 4 2 5 11 6 2 7 12 8 2 gro Manipulate the Pivottable on the Experience worksheet to calculate the inverage work experience by position for each location Construct the Pivot Table with location as the Row Labels, Position as the Column Labels, and an appropriate presentation of Operience as the store Pivot Table Select the average number of years experience for salespersions in Phoen ting the drop down ist in cel C13 of the Question worksheet. Manipulate the Pivot Table on the OMX Salary worksheet to calculate the maximum salary by gender and position Construct the Portable with Position as the Row Labels, Gender as the Column Labels, and an appropriate presentation of salary as the potable values Select the maximum salary for Female Regional Managers using the drop down let in cell 4 of the question worksheet Manipulate the Pivot Table on the Average Salary worksheet to determine if there is gender discrimination with respect to average in the company. Construct the Pivottable with Position as the Row tabels, Gender as the Column Labels, and an appropriate presentation of saryo the Pivot Table Values There would be evidence of gender discrimination with respect to salary if males have a higher average salary for three or more positions in the company Select Yes or No using the drop-down list in cells of the Question worksheet if there is evidence of gender discrimination in the company Manipulate the Plot Table on the Position worksheet to calculate the percentage of employees for each type of postion. Note that there are no bark Salary cells and each employee accounts for one salary data point Construct the Poetable with position as the Row Labe, Region as the Coun Labels, and an appropriate presentation of Salary as the values field Select the approximate percentage of all employees that are Salespensions using the drop-down fistinol 16 of the Questions worksheet Manipulate the Pivot Table on the Regional Managers worksheet to determine which locations have regional managers. Construct the hottle with Location as the Row Labels, Region as the Column Labels, and the sum of Experience as the Pivottable Value Use Position as Report Filter and display only Regional Managers in the Pivot Table Select the number of years experience for the Regional Manager in the East region using the drop-down list in cul 17 of the Questors worrot. Manipulate the Pivot Table on the salary Difference worksheet to calculate the Salesperson difference from the average Sales Managers are each region. Construct the Pivot Table with Position as the Row Labels, Region as the Column Labels, and an approprane presention of stano as the Pivot Table values Select the average difference between Salesperson and Sales Manager sauries in the West region using the drop-down list in cel C1 of the Questions worksheet 9 10 2 11 15 12 2 13 12 14 2 Total: 100 de rt AI . X D 4 . You wethe Human Resources director for the company and you weinterested in their and compensation practices in your company. The Employer Data worksheet contains information about 1200 sales employees of your company. This information includes the Gender, Location higien. Position and Salary for each lover Compite the tanks by maiting the Pivottables on each worksheet in the workbook to answer the question the time worksheet 9 30 11 Plect the cost to your wrom the drop down it for macht 14 35 16 12 Tash 2 Tack Tag Tank Task 10 Task 12 Tack 14 How many employees are in the West Region? What is the aver umber of years experience for sale in Phone? What is the maximum way for Female Region Managers? to the evidence of gender discrimination with respect to try? Appromately what percentage of employees weepersonal How many years orience does there and manage tapone? What is the differenc between the average for Sale and Manager in the West 20 21 22 24 25 26 27 25 29 30 31 12 33 10 35 36 37 38 40 Employee Data Salary once 42 Position Regional Managers Max Salary Atorage Salary Experience Questions Employees employee Pivot Tables Le weet structure You are the Human Resources director for the company and you are interested in analyzing the hiring and compensation practices in you company. The Employee Data worksheet contains information about 1200 sales employees of your company. This information includes the Gender, Name, Location (city), Region, Position, and Salary for each employee. Complete the tasks by manipulating the Pivot Taties on each worksheet in the workbook to answer the questions on the questions worksheet Task & Points Task Description Manipulate the Pivot Table on the Employees worksheet to determine how many total employees are in each region by calcatre ruber of 1 11 salaries in each region. Note there are no blank salary cells and each employee accounts for one stary data point. Pace Oreiro as the Roof the Pivot Table, and an appropriate presentation of Salary as the potable Values 2 2 Select the number of employees in the West region using the drop-down istinel 12 of the Questions worksheet Manipulate the Pivot Table on the experience worksheet to calculate the average work experience by position for each location Consulte 3 11 Pivot Table with location as the Row Labels, Position as the Column Labels, and an appropriate presentation of Experience as the values for the Pivot Table 4 2 Select the average number of years experience for salespersons in Phoenie using the drop down ist in cell C13 of the Questions weet Manipulate the Pivot Table on the Max Salary worksheet to calculate the maximum salary by gender and position Construct the Phil with stron as the Row Labels, Gender as the Column Labels, and an appropriate presentation of salary as the potable values 6 2 Select the maximum salary for Female Regional Managers using the drop-down list in cell C14 of the questions wortisht Manipulate the Pivot Table on the average Salary worksheet to determine there is pender discrimination with respect to average sales in the 7 12 company. Construct the Pivot Table with Position as the Row Labels, Ogender as the Column Labels, and an appropriate presentation of an the Pivot Table Values There would be evidence of gender discrimination with respect to salary if males have a higher verage salary for three or more possors ne company 8 2 Select Yes or No using the drop-down list in cell C15 of the Questions worksheet there is evidence of gender discrimination in the company Manipulate the Pivot Table on the Position worksheet to calculate the percentage of employees for each type of position. Note that there are no bar 9 salary cells and each employee accounts for one salary data point. Construct the Pivottable with Position as the Row Labes, Report as the com Labels, and an appropriate presentation of Salary as the values field. 10 Sched the treated mic thote Salses hadden 5 11 14 2 3 11 4 2 5 11 6 2 7 12 8 2 gro Manipulate the Pivottable on the Experience worksheet to calculate the inverage work experience by position for each location Construct the Pivot Table with location as the Row Labels, Position as the Column Labels, and an appropriate presentation of Operience as the store Pivot Table Select the average number of years experience for salespersions in Phoen ting the drop down ist in cel C13 of the Question worksheet. Manipulate the Pivot Table on the OMX Salary worksheet to calculate the maximum salary by gender and position Construct the Portable with Position as the Row Labels, Gender as the Column Labels, and an appropriate presentation of salary as the potable values Select the maximum salary for Female Regional Managers using the drop down let in cell 4 of the question worksheet Manipulate the Pivot Table on the Average Salary worksheet to determine if there is gender discrimination with respect to average in the company. Construct the Pivottable with Position as the Row tabels, Gender as the Column Labels, and an appropriate presentation of saryo the Pivot Table Values There would be evidence of gender discrimination with respect to salary if males have a higher average salary for three or more positions in the company Select Yes or No using the drop-down list in cells of the Question worksheet if there is evidence of gender discrimination in the company Manipulate the Plot Table on the Position worksheet to calculate the percentage of employees for each type of postion. Note that there are no bark Salary cells and each employee accounts for one salary data point Construct the Poetable with position as the Row Labe, Region as the Coun Labels, and an appropriate presentation of Salary as the values field Select the approximate percentage of all employees that are Salespensions using the drop-down fistinol 16 of the Questions worksheet Manipulate the Pivot Table on the Regional Managers worksheet to determine which locations have regional managers. Construct the hottle with Location as the Row Labels, Region as the Column Labels, and the sum of Experience as the Pivottable Value Use Position as Report Filter and display only Regional Managers in the Pivot Table Select the number of years experience for the Regional Manager in the East region using the drop-down list in cul 17 of the Questors worrot. Manipulate the Pivot Table on the salary Difference worksheet to calculate the Salesperson difference from the average Sales Managers are each region. Construct the Pivot Table with Position as the Row Labels, Region as the Column Labels, and an approprane presention of stano as the Pivot Table values Select the average difference between Salesperson and Sales Manager sauries in the West region using the drop-down list in cel C1 of the Questions worksheet 9 10 2 11 15 12 2 13 12 14 2 Total: 100
Step by Step Solution
There are 3 Steps involved in it

Get step-by-step solutions from verified subject matter experts