

Question: de son p 2014 (1 complete) X i Data Table * Data Table Grand Tree, Inc. Comparative Balance Sheet December 31, 2018 and 2017 2018
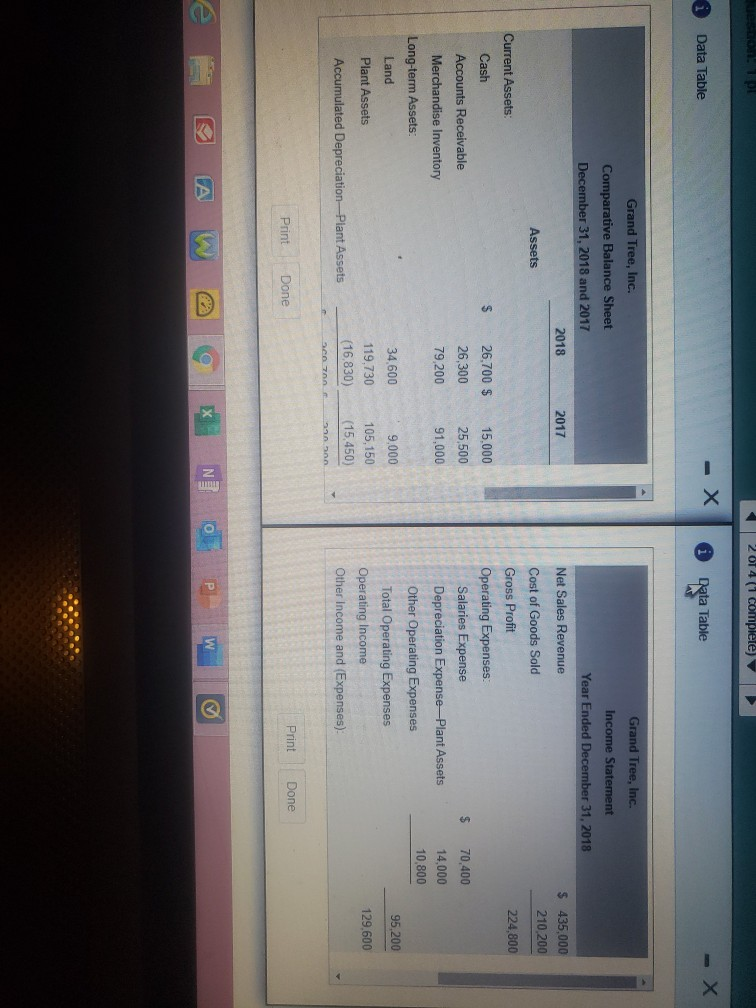
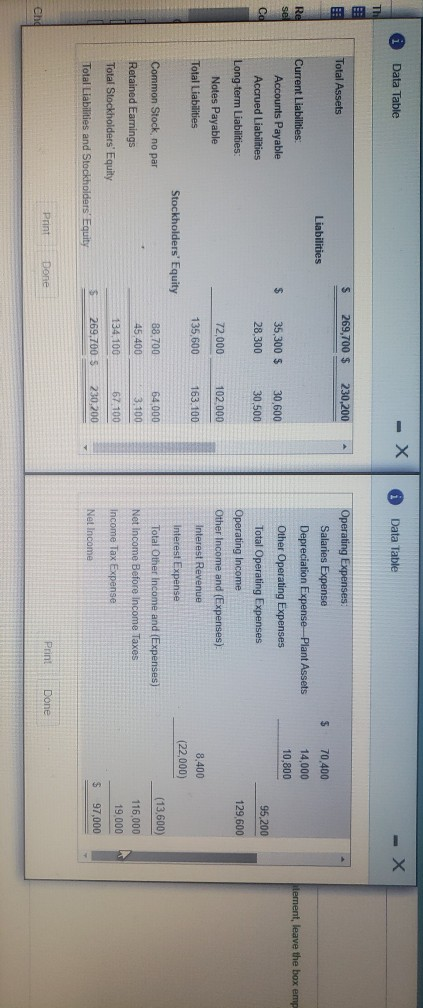
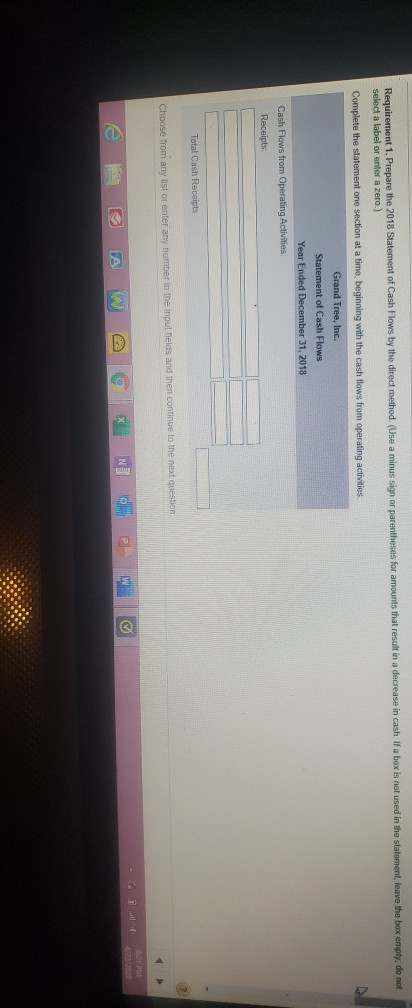
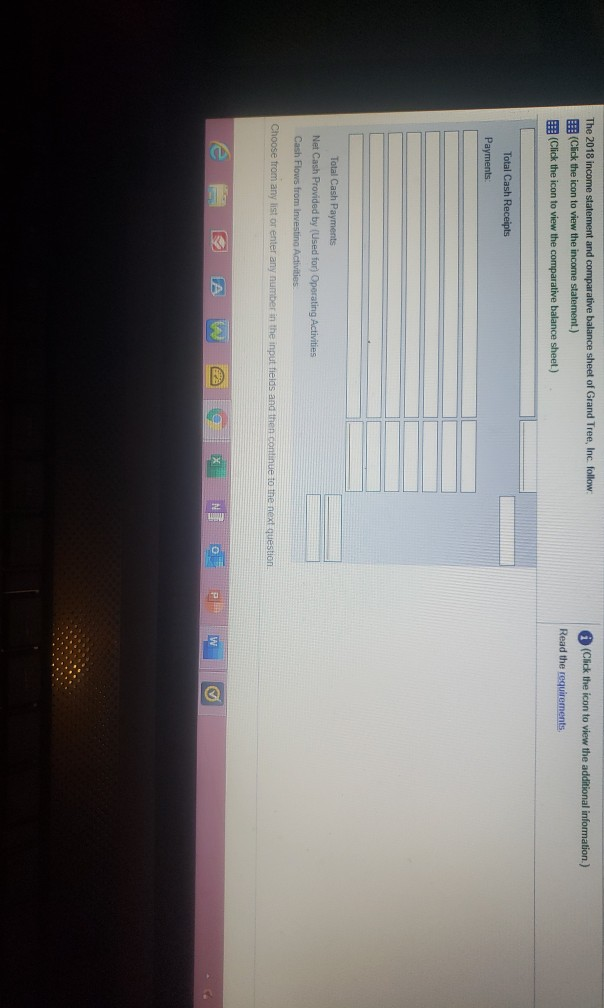
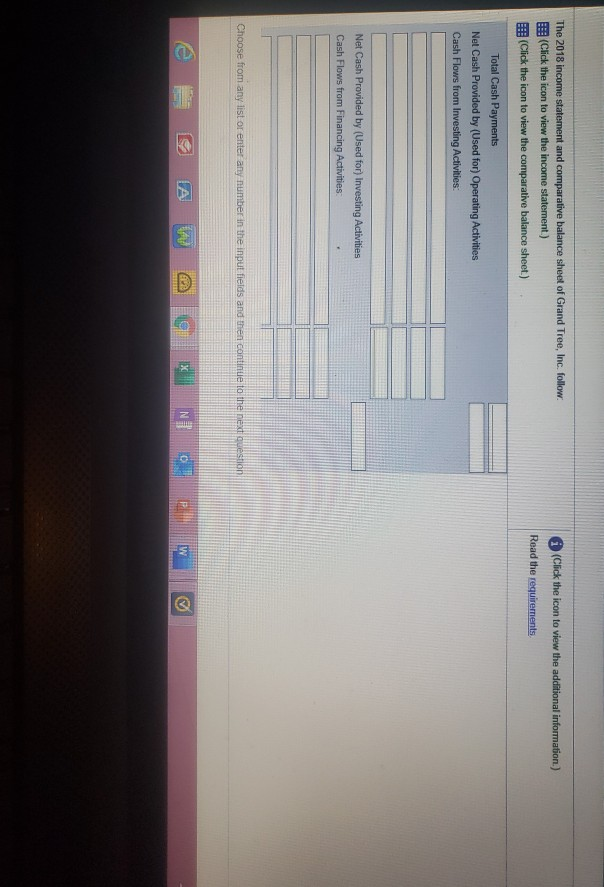
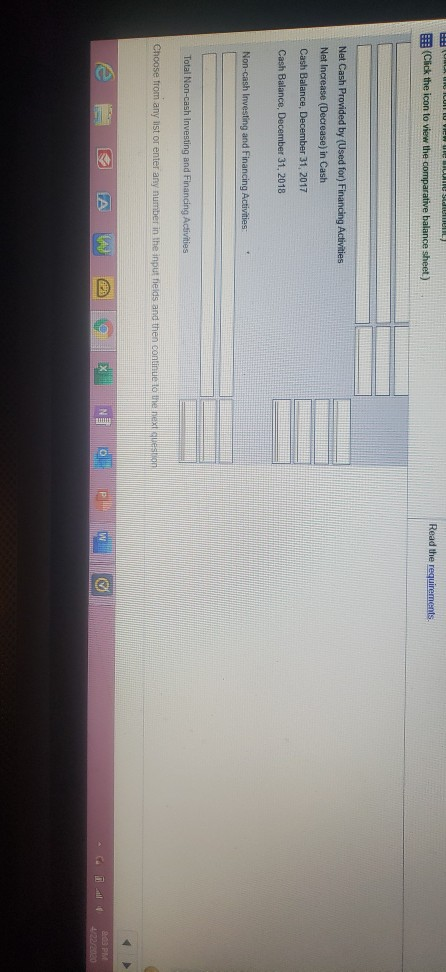
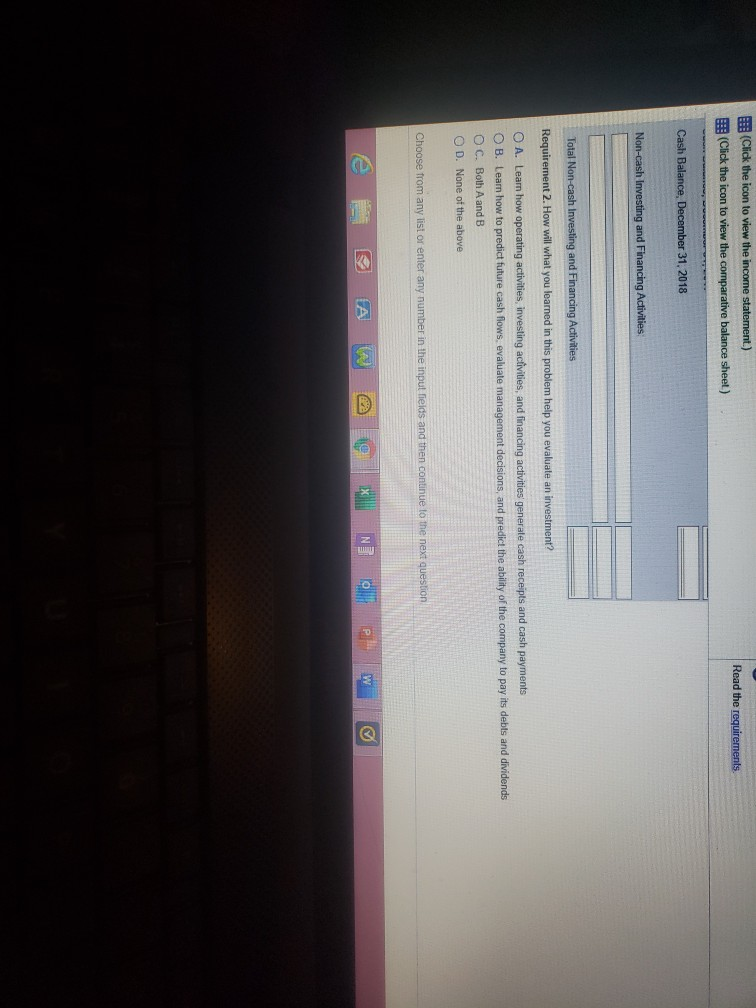
de son p 2014 (1 complete) X i Data Table * Data Table Grand Tree, Inc. Comparative Balance Sheet December 31, 2018 and 2017 2018 Assets 2017 Current Assets Cash $ 26,700 $ Grand Tree, Inc. Income Statement Year Ended December 31, 2018 Net Sales Revenue $ 435,000 Cost of Goods Sold 210.200 Gross Profit 224.800 Operating Expenses. Salaries Expense $ 70,400 Depreciation Expense-Plant Assets 14,000 10,800 Other Operating Expenses 95,200 Total Operating Expenses Operating Income 129.600 Other Income and (Expenses). Accounts Receivable 15.000 25,500 91,000 26,300 Merchandise Inventory 79,200 Long-term Assets Land Plant Assets 34.600 119,730 (16,830) 9,000 105,150 (15.450) Accumulated Depreciation-Plant Assets 500 700 Print Done Print Done e D AW @ Ox N O P w i Data Table X 1 Data Table Total Assets $ 269,700 $ 230,200 Liabilities $ 70,400 14,000 10,800 Current Liabilities: itement, leave the box emp se $ Accounts Payable Accrued Liabilities Cd Operating Expenses Salaries Expense Depreciation Expense-Plant Assets Other Operating Expenses Total Operating Expenses Operating Income Other Income and (Expenses). 35,300 $ 28,300 30,600 30,500 95,200 Long-term Liabilities: 129,600 72,000 102.000 Notes Payable Total Liabilities 135,600 163.100 Interest Revenue 8.400 (22,000) Stockholders' Equity Interest Expense Common Stock no par (13,600) Total Other Income and (Expenses) Not Income Before Income Taxes Retained Earnings 88 700 45.400 134, 100 269,700 5 64,000 3.100 67100 230,200 116,000 19.000 Total Stockholders' Equity Income Tax Expense $ 97,000 Total Liabilities and Stockholders' Equity Net Income Print Done Print Done Requirement 1. Prepare the 2018 Statement of Cash Flows by the direct method. (Use a minus sign or parentheses for amounts that result in a decrease in cash. If a box is not used in the statement, leave the box empty, do not seled a label or enter a zero.) Complete the statement one section at a time, beginning with the cash flows from operating activities Grand Tree, Inc. Statement of Cash Flows Year Ended December 31, 2018 Cash Flows from Operating Activities: Receipts Total Cash Receipts Choose from any list or enter any number in the input fields and then continue to the next question (Click the icon to view the additional information) The 2018 income statement and comparative balance sheet of Grand Tree, Inc. Follow (Click the icon to view the income statement.) (Click the icon to view the comparative balance sheet) Read the requirements Total Cash Receipts Payments: Total Cash Payments Net Cash Provided by (Used for) Operating Activities Cash Flows from investing Activities Choose from any list or enter any number in the input fields and then continue to the next question (Click the icon to view the additional information.) The 2018 income statement and comparative balance sheet of Grand Tree, Inc. follow (Click the icon to view the income statement.) (Click the icon to view the comparative balance sheet.) . Read the requirements Total Cash Payments Net Cash Provided by (Used for) Operating Activities Cash Flows from Investing Activities: Net Cash Provided by (Used for) Investing Activities Cash Flows from Financing Activities Choose from any list or enter any number in the input fields and then continue to the next question e DA OGNO de San (Click the icon to view the comparative balance sheet) Read the requirements Net Cash Provided by (Used for) Financing Activities Net Increase (Decrease) in Cash Cash Balance, December 31, 2017 Cash Balance, December 31, 2018 Non-cash Investing and Financing Activities Total Non-cash Investing and Financing Activities Choose from any list or enter any number in the input fields and then continue to the next question e AW @ NEO 2:03 PM (Click the icon to view the income statement.) :: (Click the icon to view the comparative balance sheet) Read the requirements. Cash Balance, December 31, 2018 Non-cash Investing and Financing Activities Total Non-cash Investing and Financing Activities Requirement 2. How will what you learned in this problem help you evaluate an investment? O A. Learn how operating activities, investing activities, and financing activities generate cash receipts and cash payments OB. Learn how to predict future cash flows, evaluate management decisions, and predict the ability of the company to pay its debts and dividends O C. Both A and B OD. None of the above Choose from any list or enter any number in the input fields and then continue to the next
Step by Step Solution
There are 3 Steps involved in it

Get step-by-step solutions from verified subject matter experts