

Question: Dear all, Please help in the codes to generate in R Studio in order to have below results : Link for dataset to be downloaded
Dear all,
Please help in the codes to generate in R Studio in order to have below results :
Link for dataset to be downloaded in in comments.
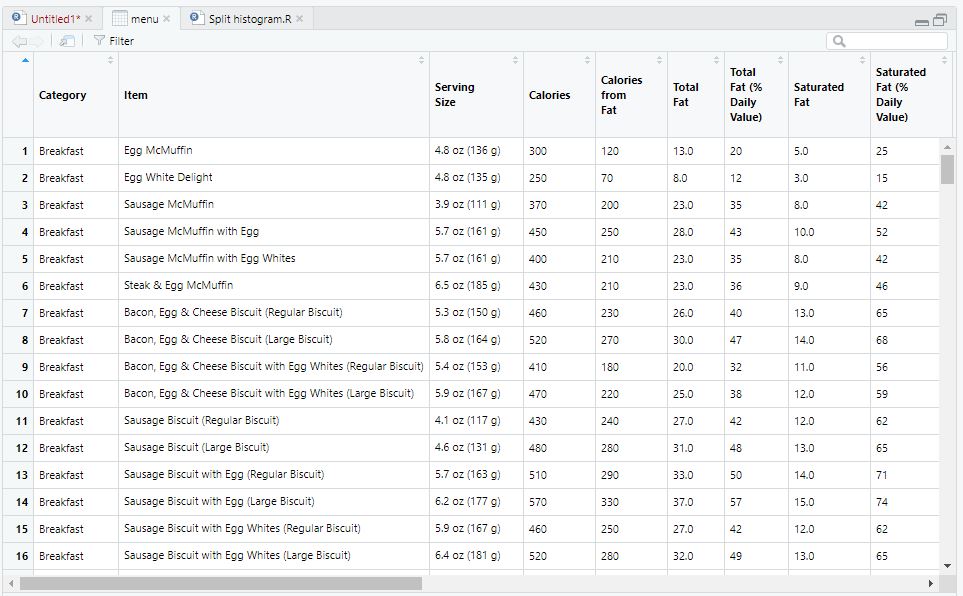
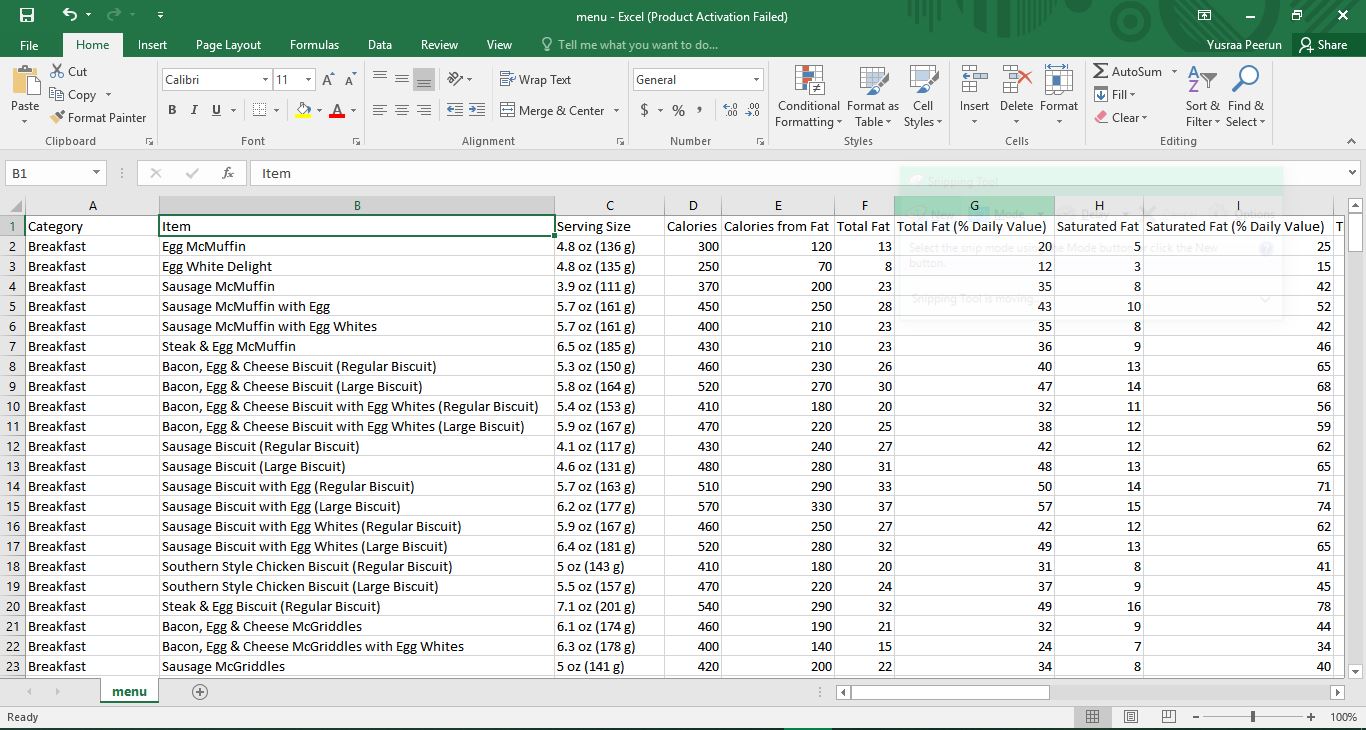
A histogram of fats and calories is drawn to know the nutritional fact available inside a serving.
With the aid of the histogram, the mean mode and median can be found where we will know which serving has the most fats.
Then a box plot shall be plotted with the values obtained above.
With the calculated data, the variance and the standard deviation can be obtained.
A graph of calories v/s fats will be plotted.
Then the covariance and correlation will be easy to find by the graph plotted above.
A hypothesis test will be carried out to test at the 5% significance level whether the total fat for breakfast is more than in chicken than in fish.
Please find below sample dataset being used :
\f\f
Step by Step Solution
There are 3 Steps involved in it

Get step-by-step solutions from verified subject matter experts