

Question: Dear all, the following problems (I attached it as an image file) are where I have stucked. Calculating for Equilibrium price and drawing graph is
Dear all, the following problems (I attached it as an image file) are where I have stucked. Calculating for Equilibrium price and drawing graph is the difficult part for me. For this reason, could you please tell me how to solve these questions?
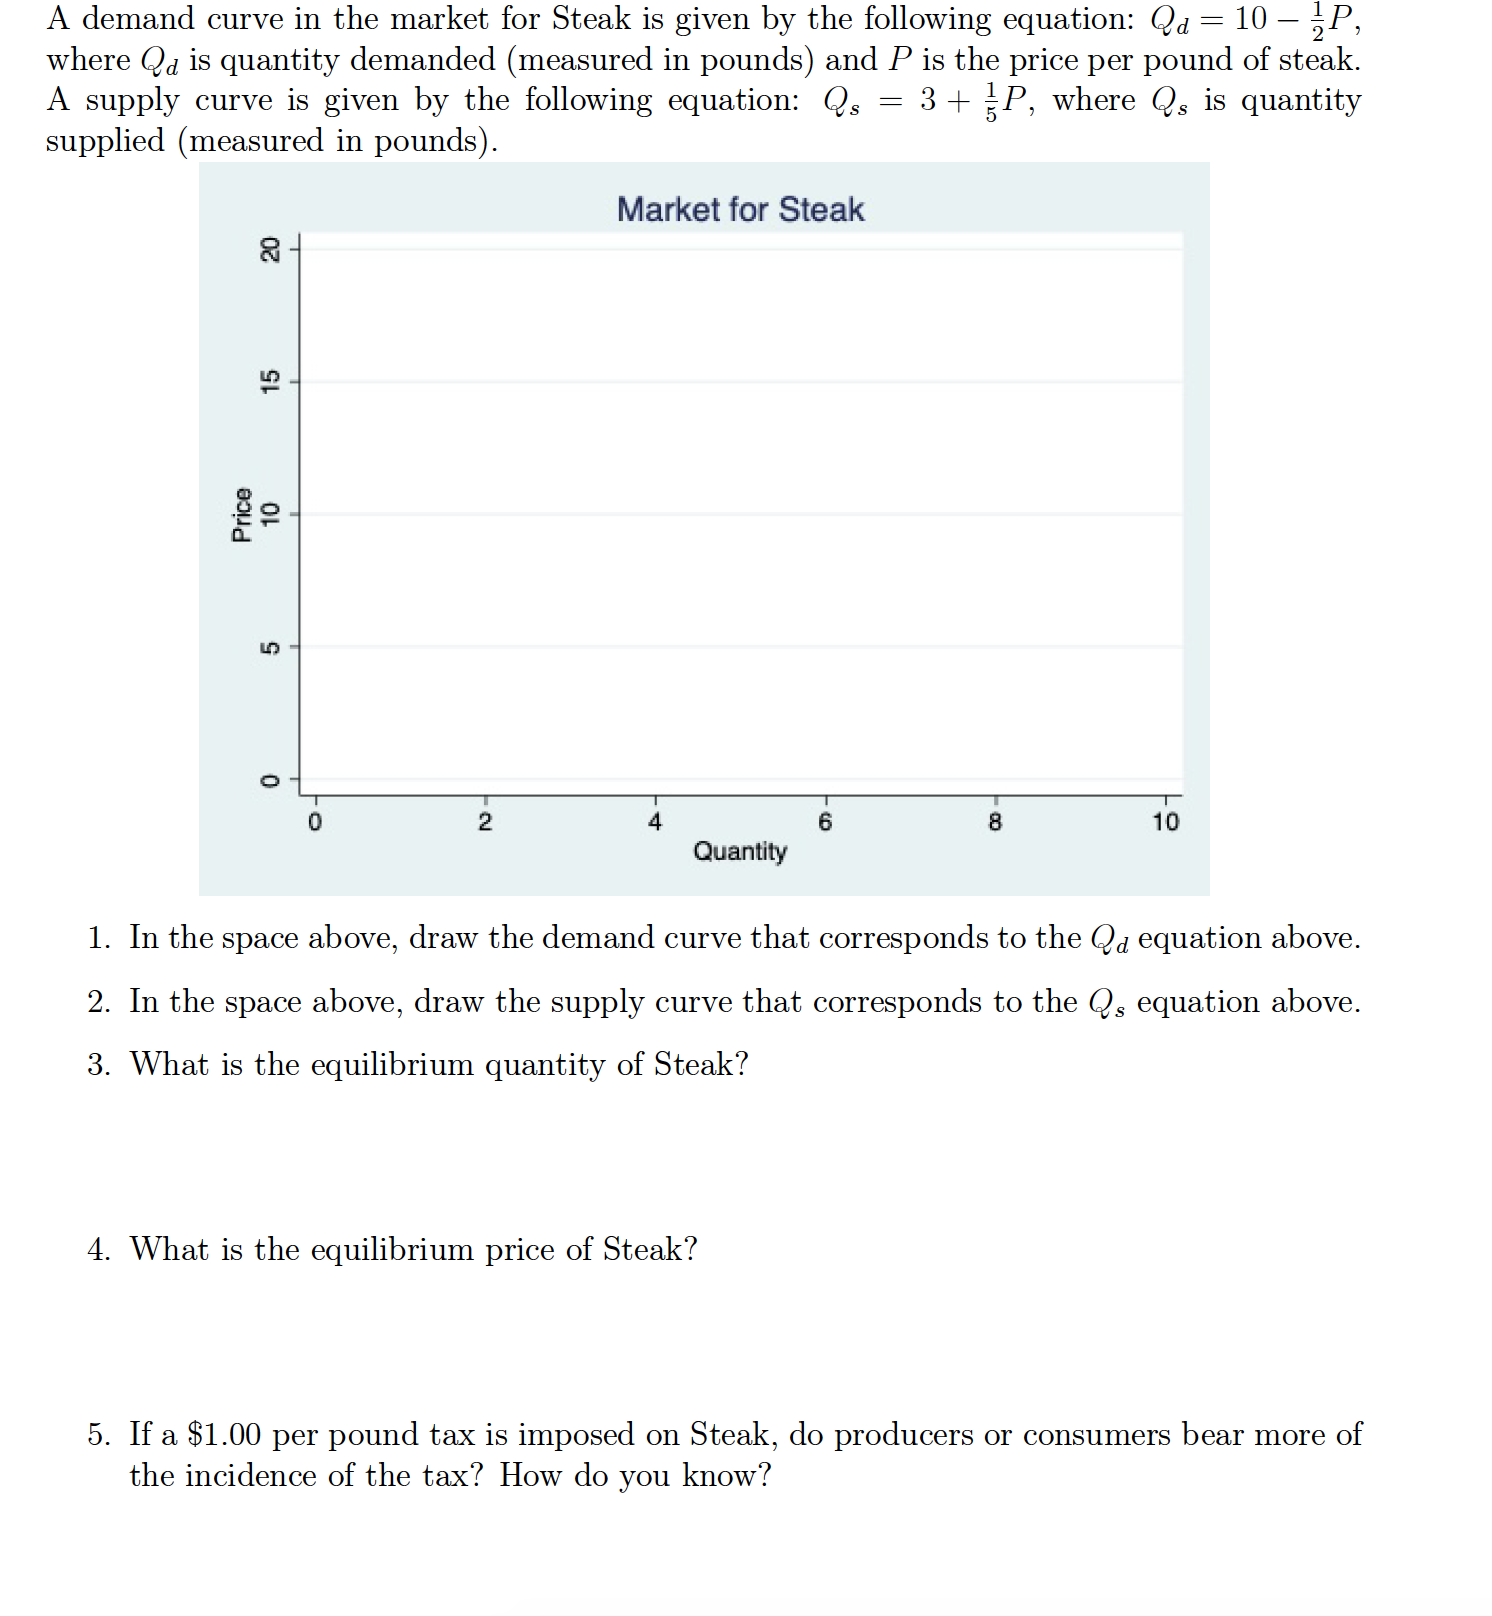
A demand curve in the market for Steak is given by the following equation: Qd : 10 P, where (24 is quantity demanded (measured in pounds) and P is the price per pound of steak. A supply curve is given by the following equation: (2, = 3 + P, where Q, is quantity supplied (measured in pounds). Market for Steak 5: a g 2 In 0 o 2 4 s 5 10 Quantity 1. In the space above, draw the demand curve that corresponds to the Q4 equation above. 2. In the space above, draw the supply curve that corresponds to the Q5 equation above. 3. What is the equilibrium quantity of Steak? 4. What is the equilibrium price of Steak? 5. If a $1.00 per pound tax is imposed on Steak, do producers or consumers bear more of the incidence of the tax? How do you know
Step by Step Solution
There are 3 Steps involved in it

Get step-by-step solutions from verified subject matter experts