

Question: Dear experts help to solve this ques - Stats and Prob beginners Thank you Q3. (a) Shares of company A are sold at RM 10.00
Dear experts help to solve this ques - Stats and Prob beginners
Thank you
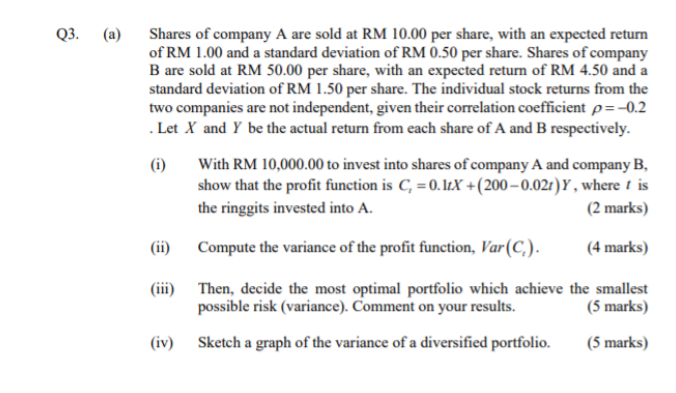
Q3. (a) Shares of company A are sold at RM 10.00 per share, with an expected return of RM 1.00 and a standard deviation of RM 0.50 per share. Shares of company B are sold at RM 50.00 per share, with an expected return of RM 4.50 and a standard deviation of RM 1.50 per share. The individual stock returns from the two companies are not independent, given their correlation coefficient p=-0.2 Let X and Y be the actual return from each share of A and B respectively. (i) With RM 10,000.00 to invest into shares of company A and company B, show that the profit function is C= 0.1tX +(200 - 0.02t)Y, where t is the ringgits invested into A. (2 marks) Compute the variance of the profit function, Var(C). (4 marks) (iii) Then, decide the most optimal portfolio which achieve the smallest possible risk (variance). Comment on your results. (5 marks) (iv) Sketch a graph of the variance of a diversified portfolio. (5 marks) Q3. (a) Shares of company A are sold at RM 10.00 per share, with an expected return of RM 1.00 and a standard deviation of RM 0.50 per share. Shares of company B are sold at RM 50.00 per share, with an expected return of RM 4.50 and a standard deviation of RM 1.50 per share. The individual stock returns from the two companies are not independent, given their correlation coefficient p=-0.2 Let X and Y be the actual return from each share of A and B respectively. (i) With RM 10,000.00 to invest into shares of company A and company B, show that the profit function is C= 0.1tX +(200 - 0.02t)Y, where t is the ringgits invested into A. (2 marks) Compute the variance of the profit function, Var(C). (4 marks) (iii) Then, decide the most optimal portfolio which achieve the smallest possible risk (variance). Comment on your results. (5 marks) (iv) Sketch a graph of the variance of a diversified portfolio
Step by Step Solution
There are 3 Steps involved in it

Get step-by-step solutions from verified subject matter experts