

Question: Dear Tutor, Please explain about this chart visualization and also pros and cons on this chart? appreciate your help Import price of Uranium (US) correlates
Dear Tutor, Please explain about this chart visualization and also pros and cons on this chart? appreciate your help
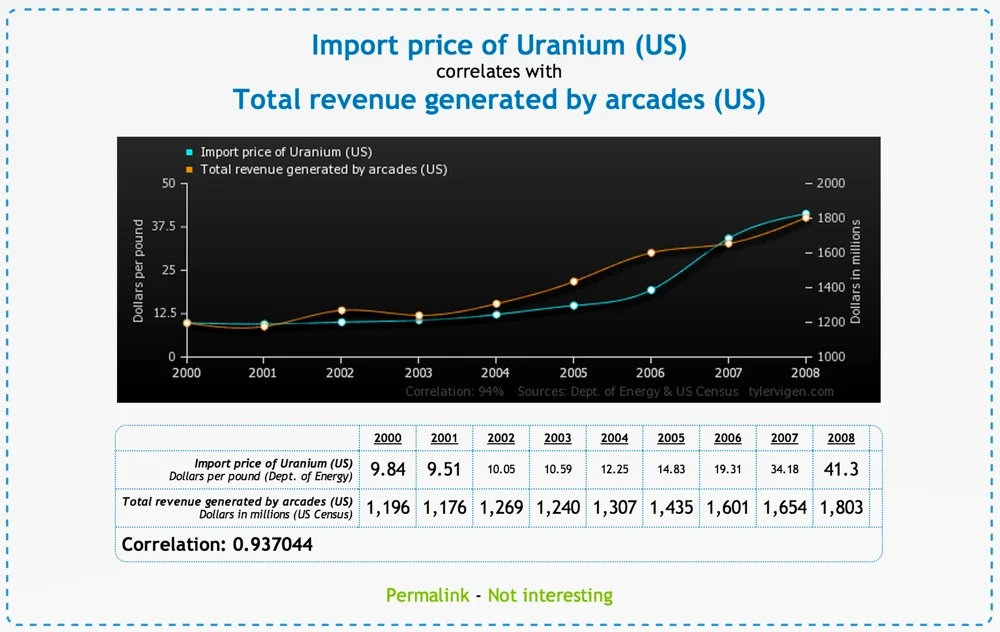
Import price of Uranium (US) correlates with Total revenue generated by arcades (US) Import price of Uranium (US) 50 Total revenue generated by arcades (US) - 2000 Dollars per pound 37.5 1800 - 1600 25 - 1400 12.5- - 1200 Dollars in millions 0 - T 1000 2000 2001 2002 2003 2004 2005 2006 2007 2008 Correlation: 94% Sources: Dept. of Energy & US Census tylervigen.com 2000 2001 2002 2003 2004 2005 2006 2007 2008 Import price of Uranium (US) Dollars per pound (Dept. of Energy) 9.84 9.51 10.05 10.59 12.25 14.83 19.31 34.18 41.3 Total revenue generated by arcades (US) Dollars in millions (US Census) 1, 196 1, 176 1,269 1,240 1,307 1,435 1,601 1,654 1,803 Correlation: 0.937044 Permalink - Not interesting
Step by Step Solution
There are 3 Steps involved in it

Get step-by-step solutions from verified subject matter experts