

Question: Dear tutor,please help me with this Time Series question. Thanks. 5 The following table shows the quarterly averages of the number of rooms occupied per
Dear tutor,please help me with this Time Series question. Thanks.
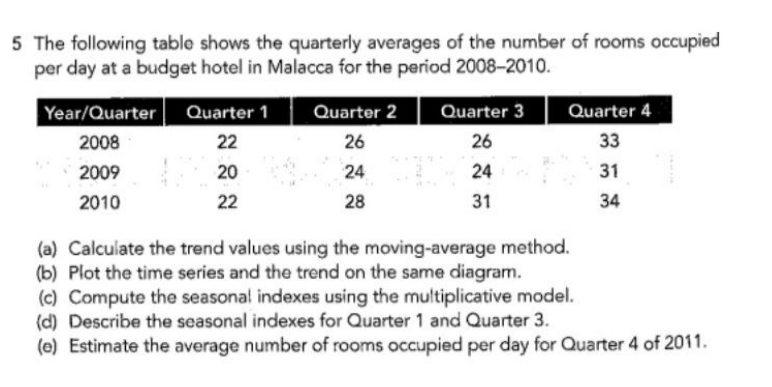
5 The following table shows the quarterly averages of the number of rooms occupied per day at a budget hotel in Malacca for the period 2008-2010. Year/Quarter | Quarter 1 | Quarter 2 2008 22 26 26 33 2009 20 24 24 31 2010 22 28 31 34 (a) Calculate the trend values using the moving-average method. (b) Plot the time series and the trend on the same diagram. (c) Compute the seasonal indexes using the multiplicative model. (d) Describe the seasonal indexes for Quarter 1 and Quarter 3. (e) Estimate the average number of rooms occupied per day for Quarter 4 of 2011
Step by Step Solution
There are 3 Steps involved in it

Get step-by-step solutions from verified subject matter experts