

Question: Dec 31, 2020 Dec. 31. 2019 Dec. 31. 2018 Current assets Cash $11.500 $35,100 $32,300 Accounts receivable 16.900 14,000 9,800 Inventory 171.400 124,800 116,900 I
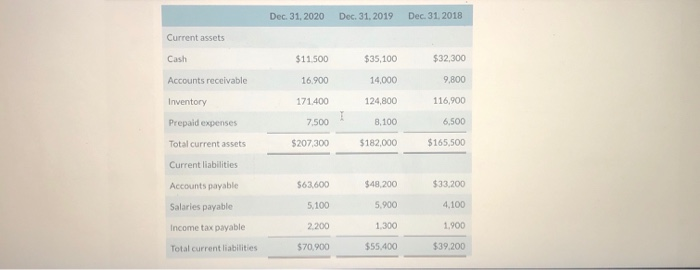
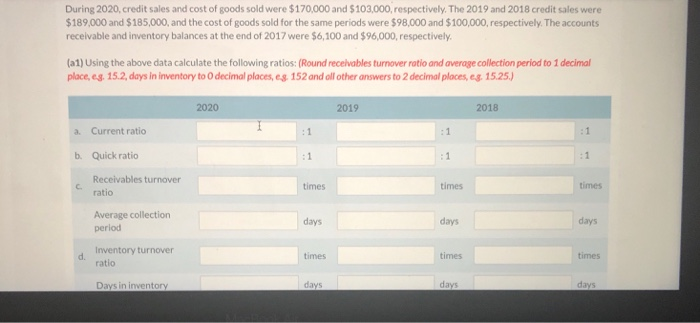
Dec 31, 2020 Dec. 31. 2019 Dec. 31. 2018 Current assets Cash $11.500 $35,100 $32,300 Accounts receivable 16.900 14,000 9,800 Inventory 171.400 124,800 116,900 I Prepaid expenses 7.500 8,100 6.500 Total current assets $207,300 $182,000 $165,500 Current liabilities Accounts payable $63.600 $48,200 $33,200 Salaries payable 5,100 5.900 4.100 Income tax payable 2.200 1.300 1.900 Total current liabilities $70.900 $55,400 $39.200 During 2020, credit sales and cost of goods sold were $170,000 and $103,000, respectively. The 2019 and 2018 credit sales were $189,000 and $185,000, and the cost of goods sold for the same periods were $98,000 and $100,000, respectively. The accounts receivable and inventory balances at the end of 2017 were $6,100 and $96,000, respectively. (a1) Using the above data calculate the following ratios: (Round receivables turnover ratio and average collection period to 1 decimal place, eg, 15.2, days in inventory to decimal places, eg 152 and all other answers to 2 decimal places, eg. 15.25.) 2020 2019 2018 a. Current ratio :1 b. Quick ratio :1 :1 C Receivables turnover ratio times times times Average collection period days days days d. Inventory turnover ratio times times times Days in inventory days days days
Step by Step Solution
There are 3 Steps involved in it

Get step-by-step solutions from verified subject matter experts