

Question: December 2018 QUESTION 4 The table below shows the length of time to brew coffee when Coffee Shop X opened for three days. Time (minutes)
December 2018
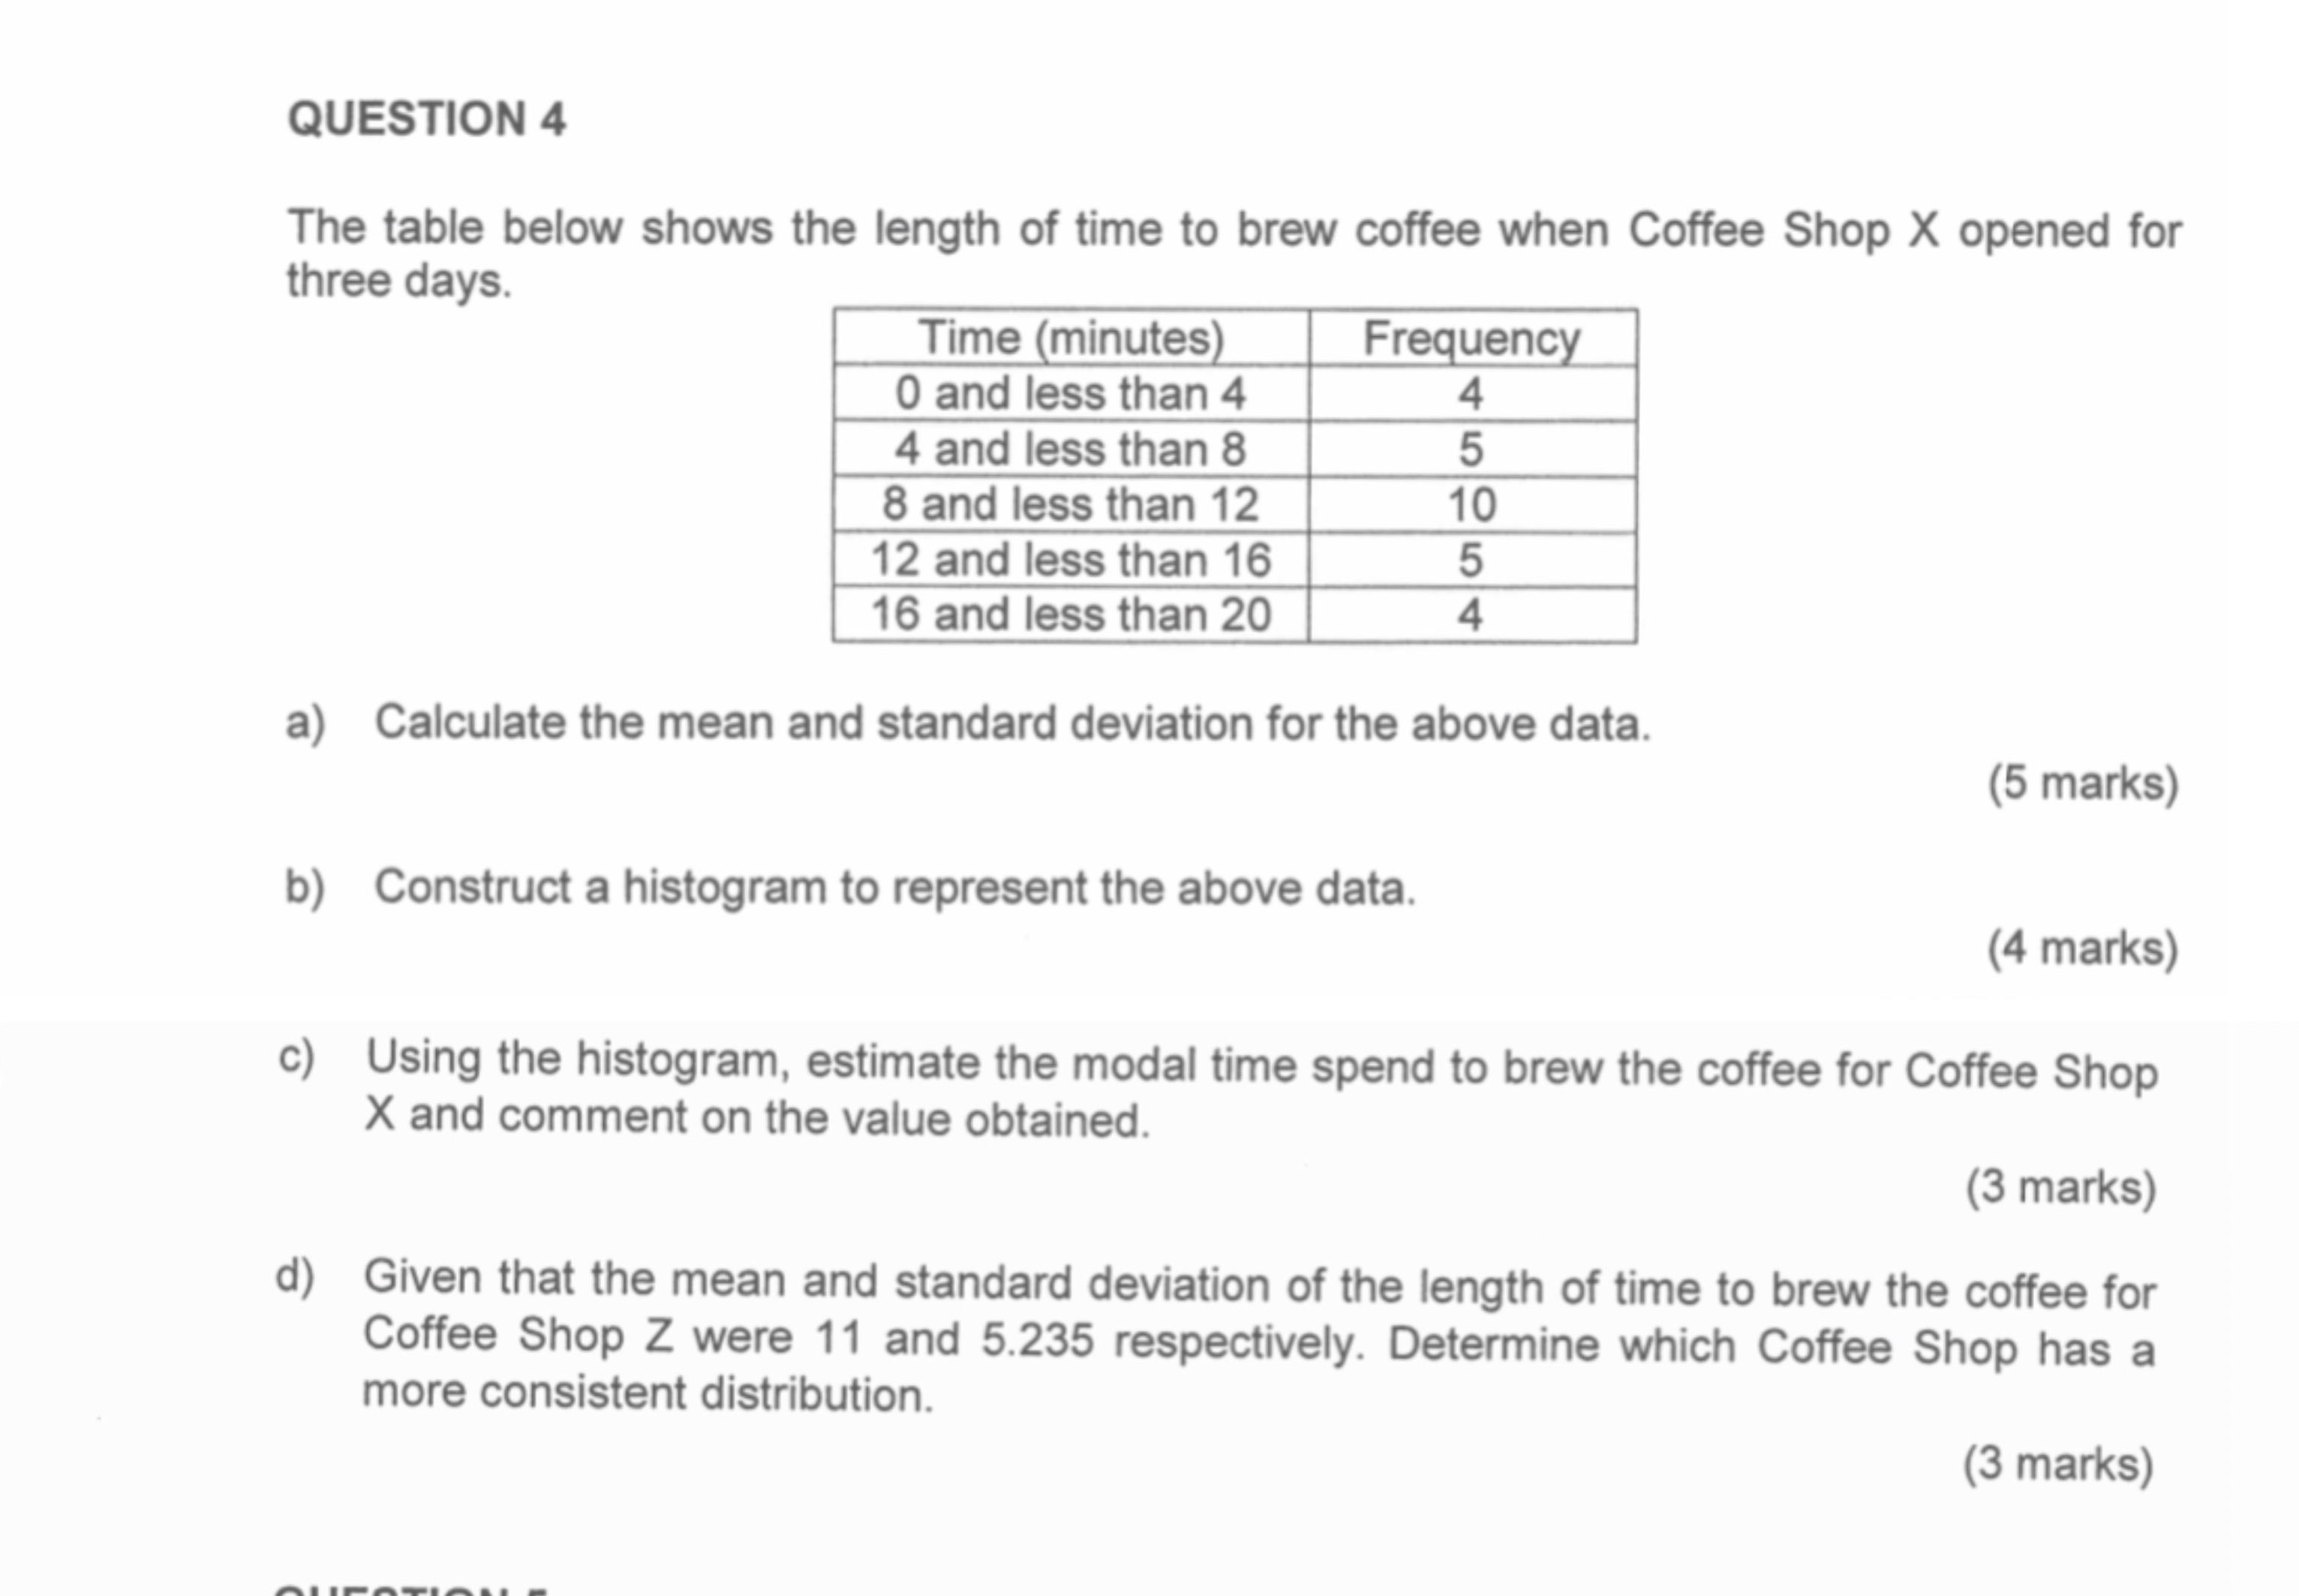
QUESTION 4 The table below shows the length of time to brew coffee when Coffee Shop X opened for three days. Time (minutes) Frequency 0 and less than 4 4 4 and less than 8 5 8 and less than 12 10 12 and less than 16 5 16 and less than 20 4 a) Calculate the mean and standard deviation for the above data. (5 marks) b) Construct a histogram to represent the above data. (4 marks) c) Using the histogram, estimate the modal time spend to brew the coffee for Coffee Shop X and comment on the value obtained. (3 marks) d) Given that the mean and standard deviation of the length of time to brew the coffee for Coffee Shop Z were 11 and 5.235 respectively. Determine which Coffee Shop has a more consistent distribution
Step by Step Solution
There are 3 Steps involved in it

Get step-by-step solutions from verified subject matter experts