

Question: Deconvolution of a Spectrum I. Use the data in Table 14-6 (also found on the CD in the worksheet Deconvolution I) to deconvolute the spectrum.
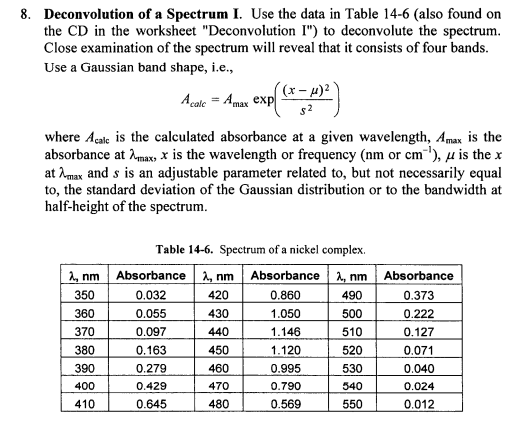
Deconvolution of a Spectrum I. Use the data in Table 14-6 (also found on the CD in the worksheet "Deconvolution I") to deconvolute the spectrum. Close examination of the spectrum will reveal that it consists of four bands. Use a Gaussian band shape, i.e., Acalc=Amaxexp(s2(x)2) where Acalc is the calculated absorbance at a given wavelength, Amax is the absorbance at max,x is the wavelength or frequency (nm or cm1 ), is the x at max and s is an adjustable parameter related to, but not necessarily equal to, the standard deviation of the Gaussian distribution or to the bandwidth at half-height of the spectrum. Table 14-6. Spectrum of a nickel complex
Step by Step Solution
There are 3 Steps involved in it

Get step-by-step solutions from verified subject matter experts