

Question: DEEI 2420 QUESTION 3 MATLAB Script Q3 is intended to sample a continuous signal and plot the frequency spectrum of the sampled signal. Run the
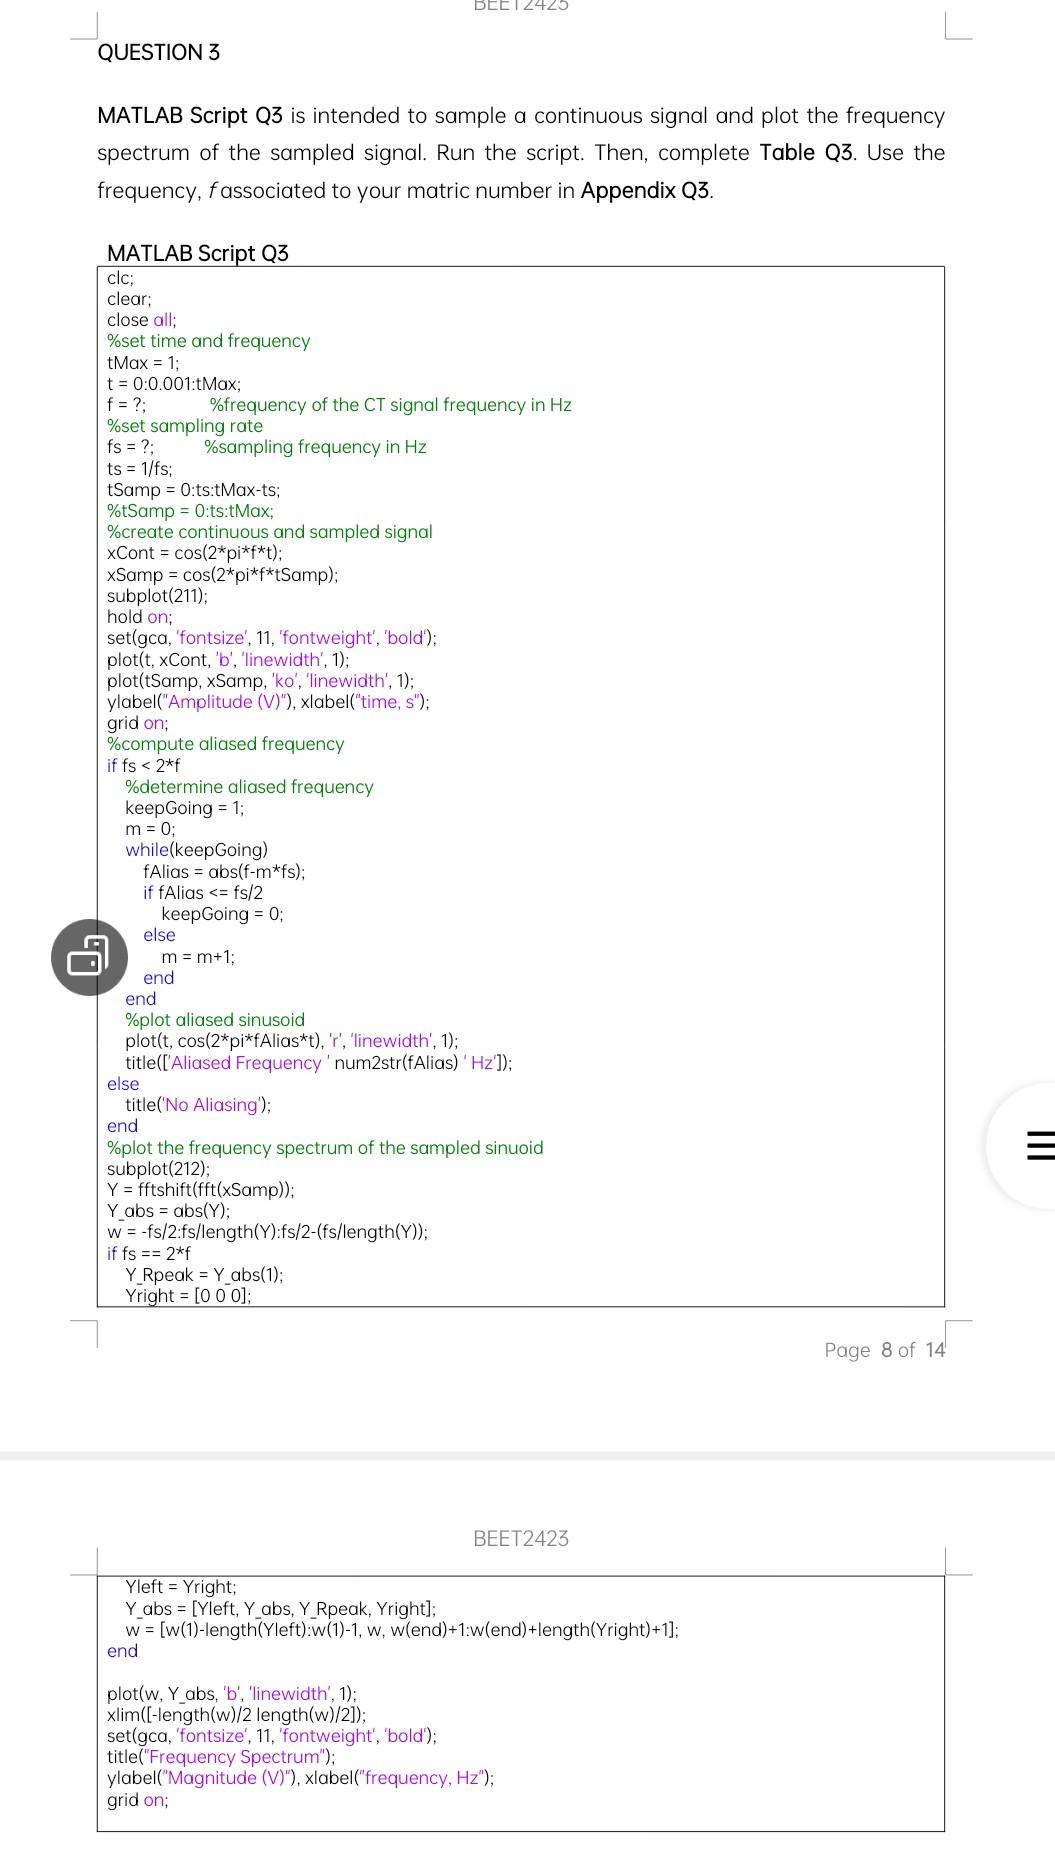
DEEI 2420 QUESTION 3 MATLAB Script Q3 is intended to sample a continuous signal and plot the frequency spectrum of the sampled signal. Run the script. Then, complete Table Q3. Use the frequency, fassociated to your matric number in Appendix Q3. MATLAB Script Q3 clc; clear; close all; %set time and frequency tMax = 1; t = 0:0.001: Max; f = ?: %frequency of the CT signal frequency in Hz %set sampling rate fs = ?; %sampling frequency in Hz ts = 1/fs; tSamp = 0:ts:tMax-ts; %tSamp = 0:ts:tMax; %create continuous and sampled signal xCont = cos(2*pi*f*t); xSamp = cos(2*pi*f*tSamp); subplot(211); hold on; set(gca, 'fontsize', 11, 'fontweight', 'bold'); plot(t, xCont, 'b', 'linewidth', 1); plot(tSamp, xSamp, 'ko', 'linewidth', 1); ylabel("Amplitude (V)"), xlabel("time, s"); grid on; %compute aliased frequency if fs
Step by Step Solution
There are 3 Steps involved in it

Get step-by-step solutions from verified subject matter experts