

Question: Define a vector V with many elements (10,000 or 100,000 or more) and compute its histogram with 120 bins (or buckets) and assign this histogram
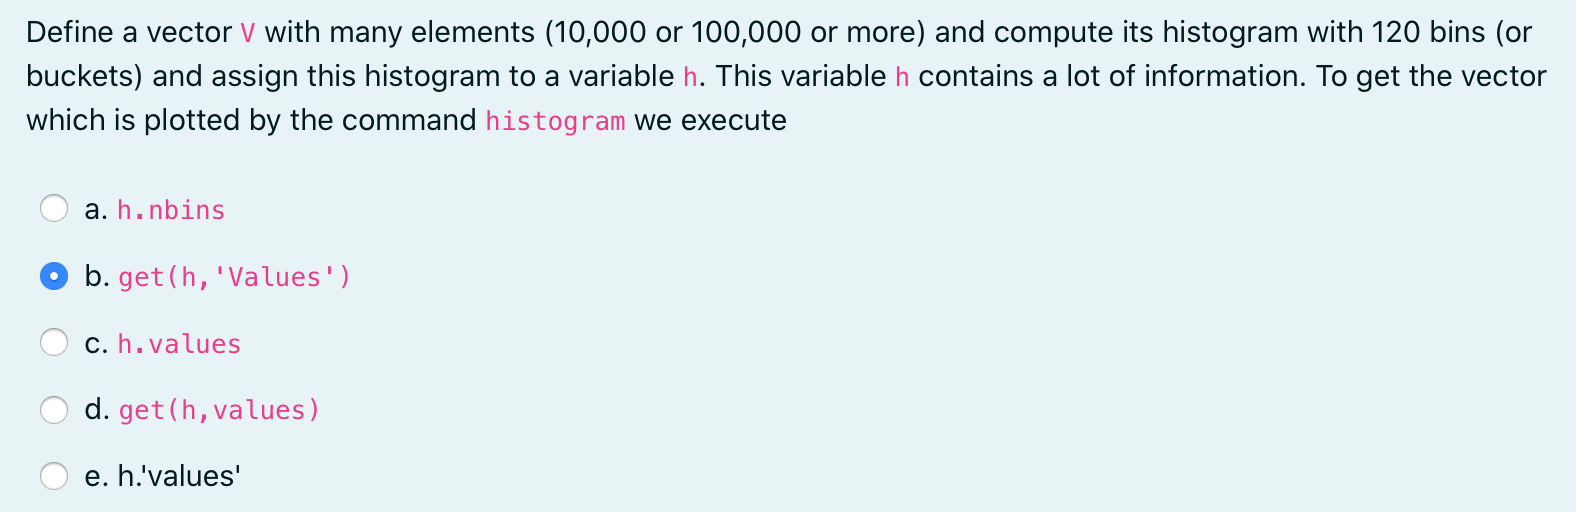
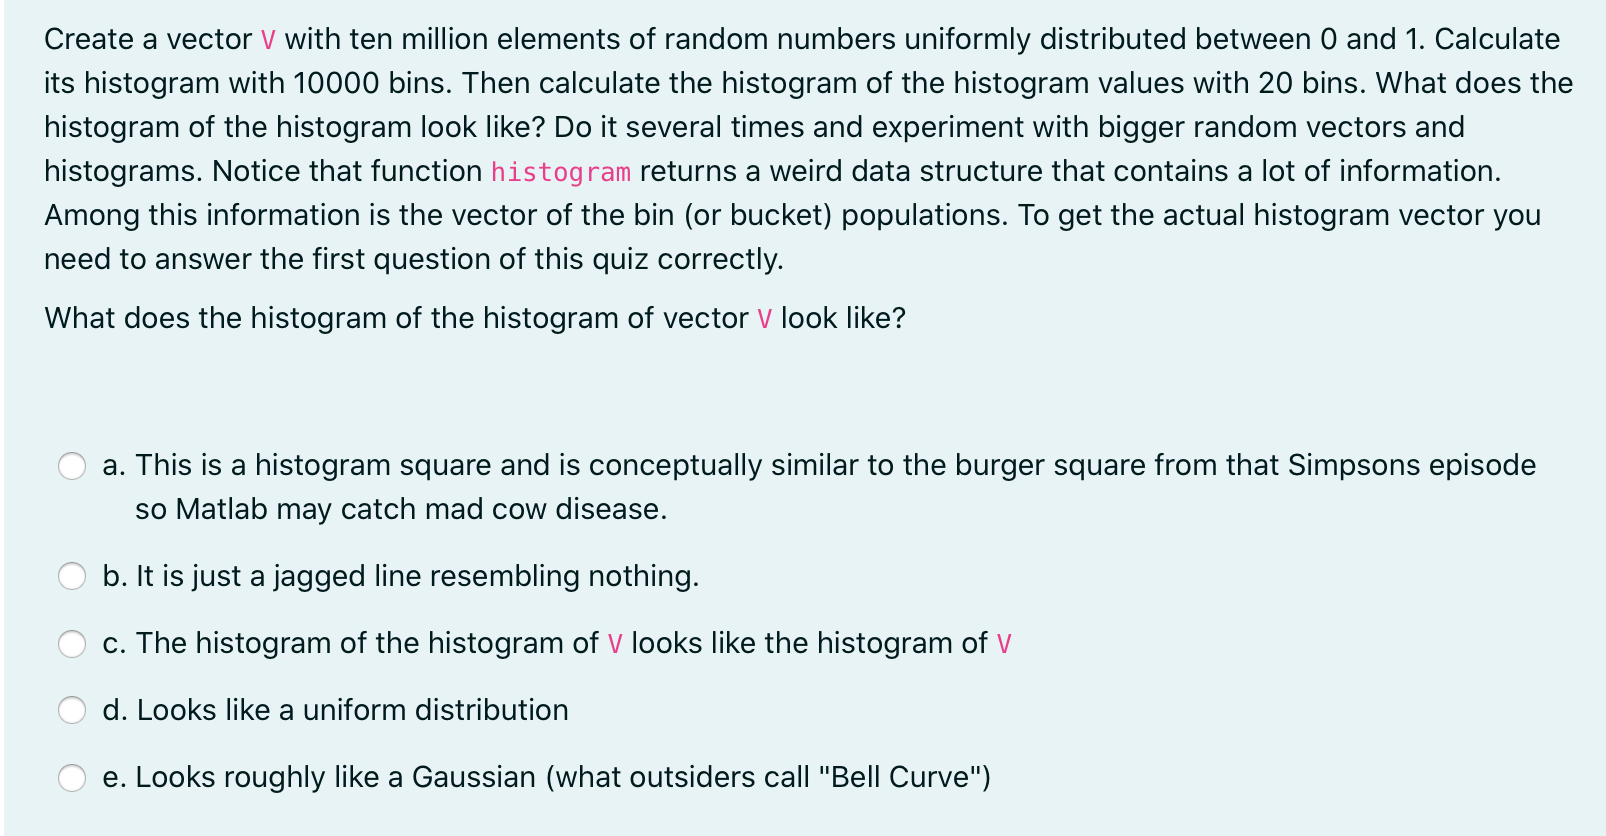
Define a vector V with many elements (10,000 or 100,000 or more) and compute its histogram with 120 bins (or buckets) and assign this histogram to a variable h. This variable h contains a lot of information. To get the vector which is plotted by the command histogram we execute a. h.nbins b. get(h, 'Values') c. h. values d.get(h, values) e. h.'values' Create a vector V with ten million elements of random numbers uniformly distributed between 0 and 1. Calculate its histogram with 10000 bins. Then calculate the histogram of the histogram values with 20 bins. What does the histogram of the histogram look like? Do it several times and experiment with bigger random vectors and histograms. Notice that function histogram returns a weird data structure that contains a lot of information. Among this information is the vector of the bin (or bucket) populations. To get the actual histogram vector you need to answer the first question of this quiz correctly. What does the histogram of the histogram of vector v look like? a. This is a histogram square and is conceptually similar to the burger square from that Simpsons episode so Matlab may catch mad cow disease. b. It is just a jagged line resembling nothing. c. The histogram of the histogram of v looks like the histogram of v d. Looks like a uniform distribution e. Looks roughly like a Gaussian (what outsiders call "Bell Curve")
Step by Step Solution
There are 3 Steps involved in it

Get step-by-step solutions from verified subject matter experts