

Question: define the decision variables, write objective equation and constraint equations draw a graph to represent the set of feasible alternatives compute the risk and return
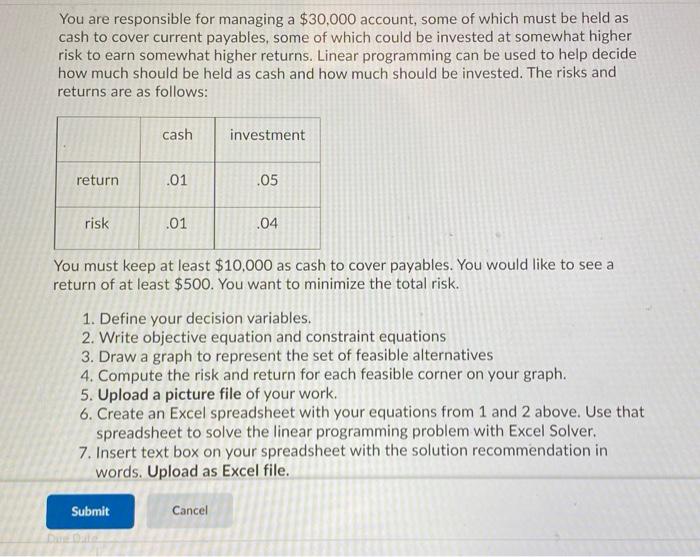
You are responsible for managing a $30,000 account, some of which must be held as cash to cover current payables, some of which could be invested at somewhat higher risk to earn somewhat higher returns. Linear programming can be used to help decide how much should be held as cash and how much should be invested. The risks and returns are as follows: cash investment return .01 .05 risk .01 .04 You must keep at least $10,000 as cash to cover payables. You would like to see a return of at least $500. You want to minimize the total risk. 1. Define your decision variables. 2. Write objective equation and constraint equations 3. Draw a graph to represent the set of feasible alternatives 4. Compute the risk and return for each feasible corner on your graph. 5. Upload a picture file of your work. 6. Create an Excel spreadsheet with your equations from 1 and 2 above. Use that spreadsheet to solve the linear programming problem with Excel Solver. 7. Insert text box on your spreadsheet with the solution recommendation in words. Upload as Excel file. Submit Cancel You are responsible for managing a $30,000 account, some of which must be held as cash to cover current payables, some of which could be invested at somewhat higher risk to earn somewhat higher returns. Linear programming can be used to help decide how much should be held as cash and how much should be invested. The risks and returns are as follows: cash investment return .01 .05 risk .01 .04 You must keep at least $10,000 as cash to cover payables. You would like to see a return of at least $500. You want to minimize the total risk. 1. Define your decision variables. 2. Write objective equation and constraint equations 3. Draw a graph to represent the set of feasible alternatives 4. Compute the risk and return for each feasible corner on your graph. 5. Upload a picture file of your work. 6. Create an Excel spreadsheet with your equations from 1 and 2 above. Use that spreadsheet to solve the linear programming problem with Excel Solver. 7. Insert text box on your spreadsheet with the solution recommendation in words. Upload as Excel file. Submit Cancel
Step by Step Solution
There are 3 Steps involved in it

Get step-by-step solutions from verified subject matter experts