

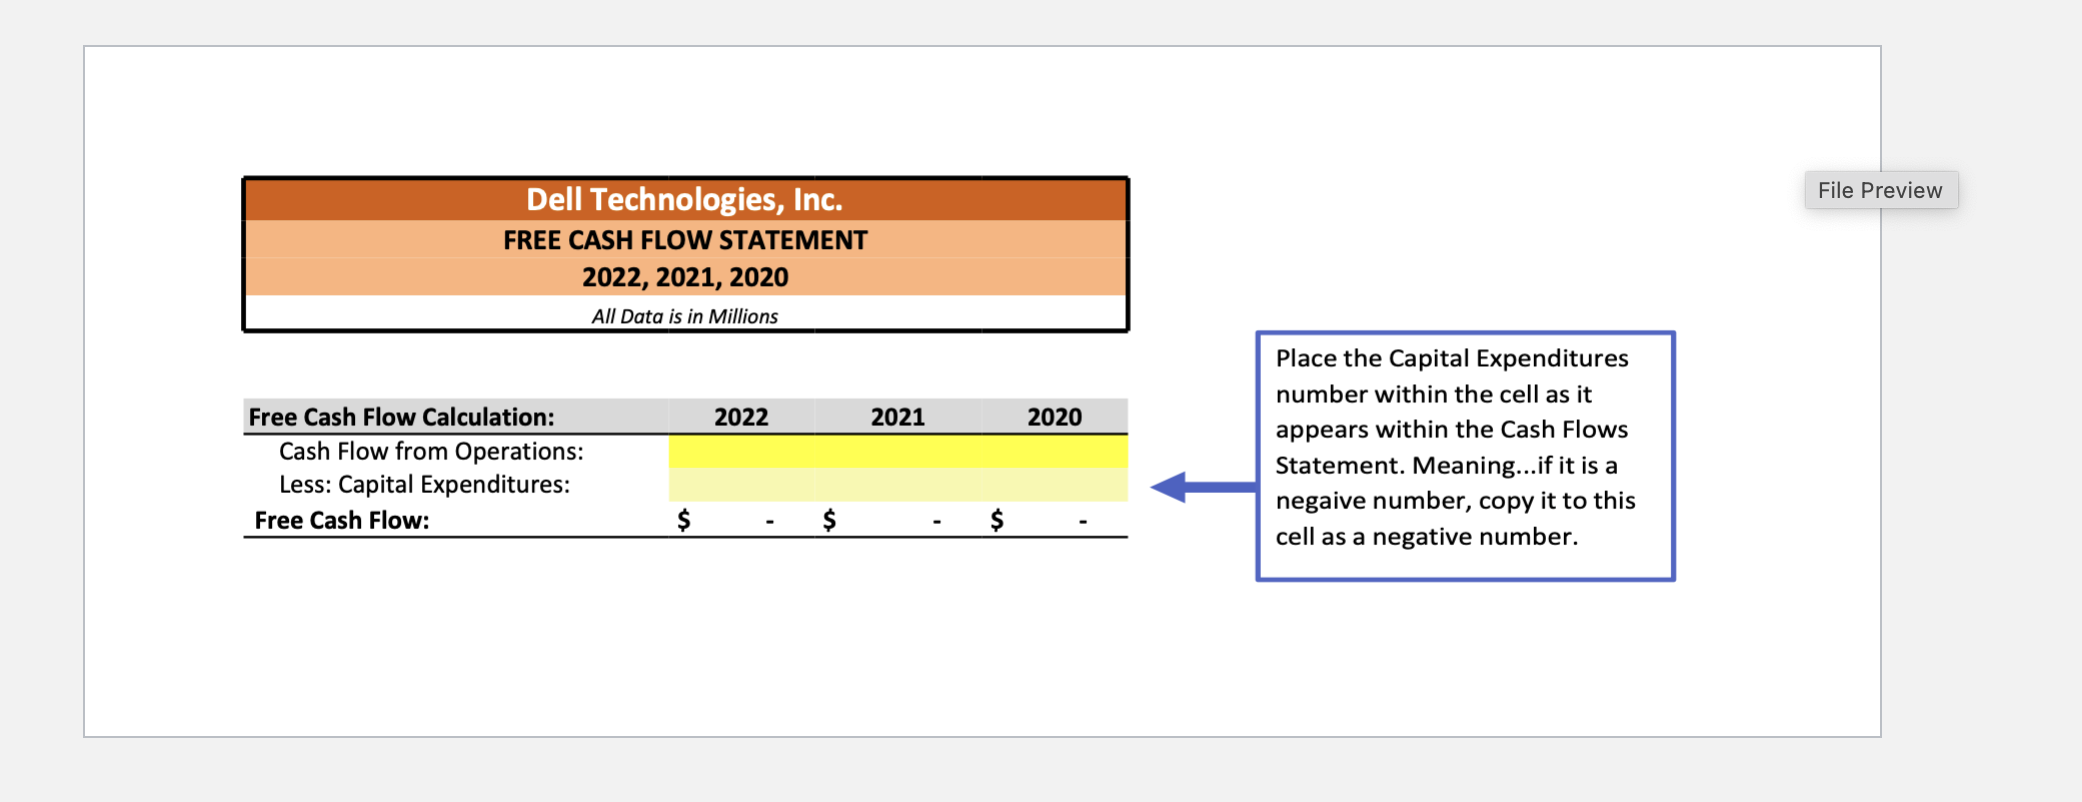
Dell Technologies, Inc. FREE CASH FLOW STATEMENT 2022, 2021, 2020 All Data is in Millions Free...
Fantastic news! We've Found the answer you've been seeking!
Question:
Transcribed Image Text:
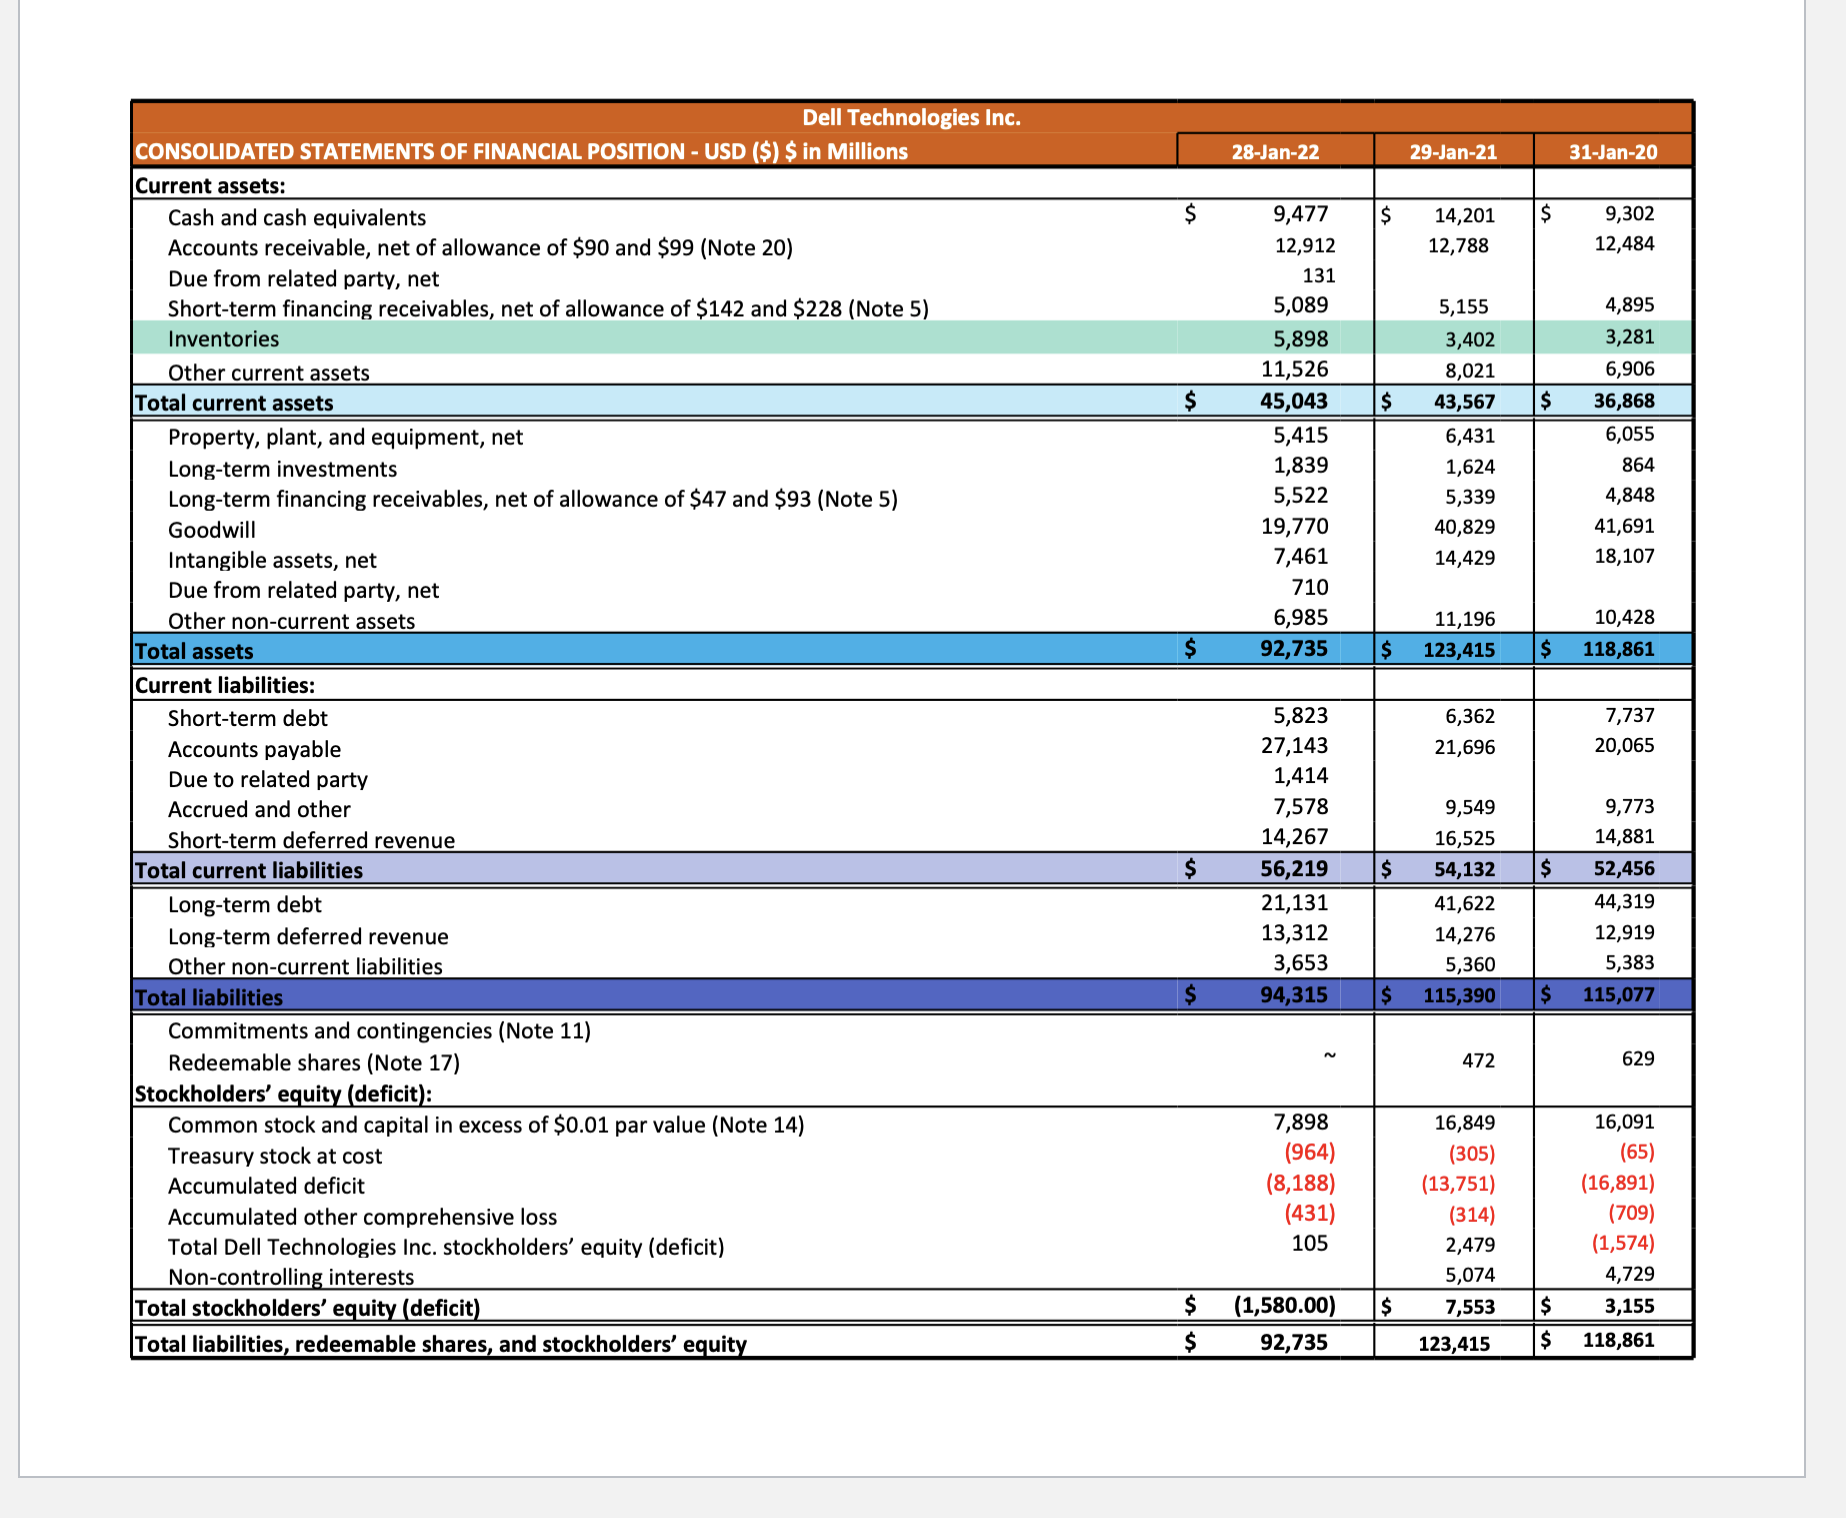
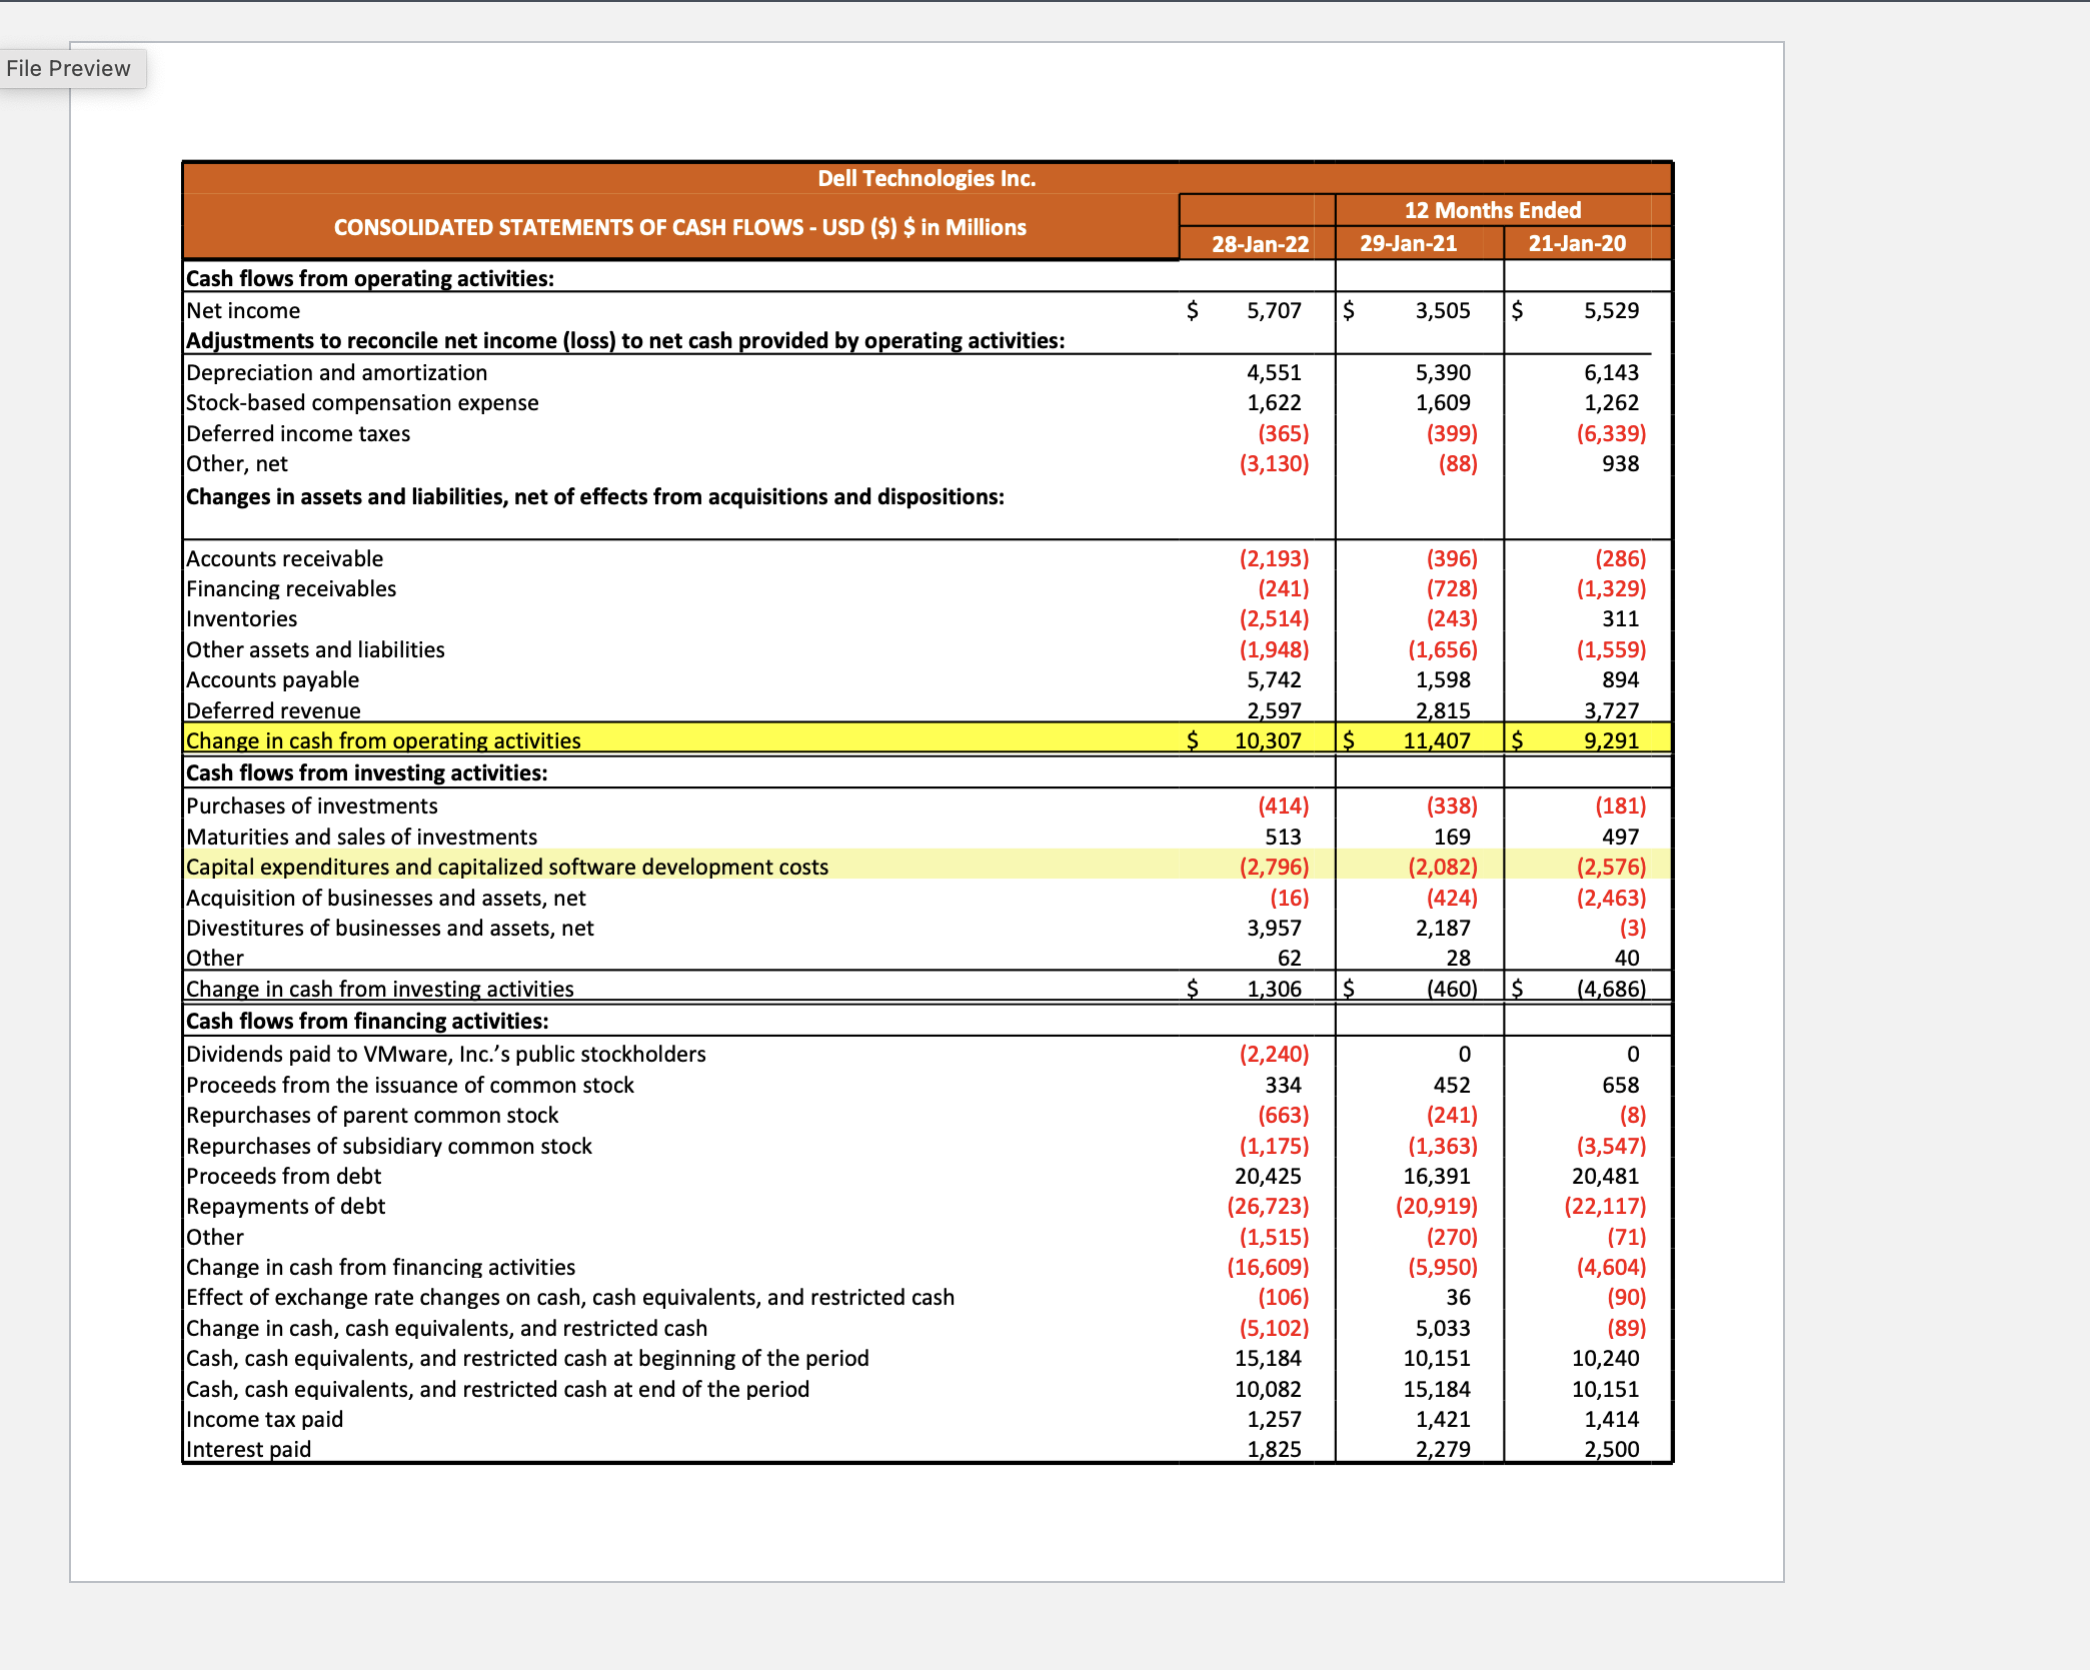
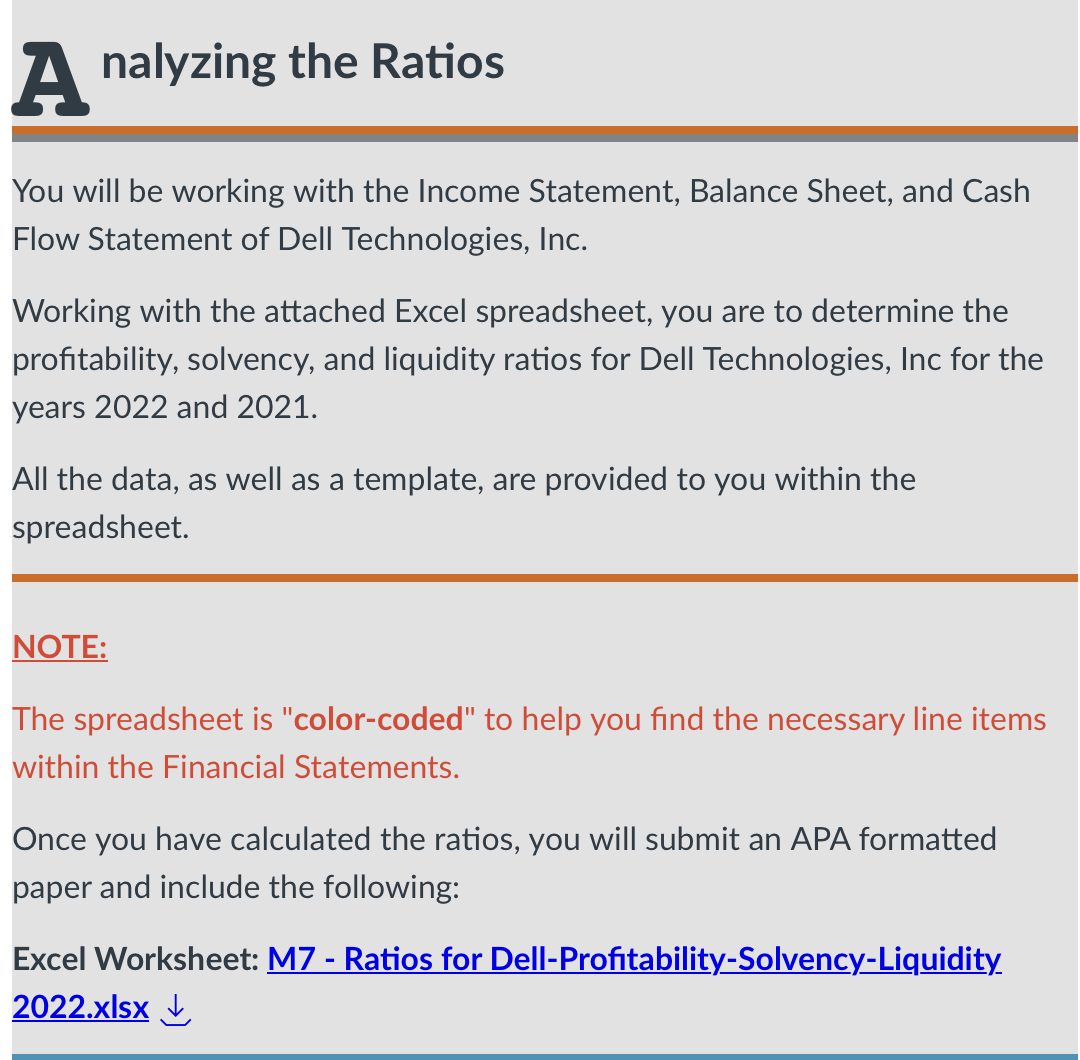
Dell Technologies, Inc. FREE CASH FLOW STATEMENT 2022, 2021, 2020 All Data is in Millions Free Cash Flow Calculation: Cash Flow from Operations: Less: Capital Expenditures: Free Cash Flow: $ 2022 2021 2020 Place the Capital Expenditures number within the cell as it appears within the Cash Flows Statement. Meaning...if it is a negaive number, copy it to this cell as a negative number. File Preview Dell Technologies Inc. CONSOLIDATED STATEMENTS OF FINANCIAL POSITION - USD ($) $ in Millions Current assets: Cash and cash equivalents Accounts receivable, net of allowance of $90 and $99 (Note 20) Due from related party, net Short-term financing receivables, net of allowance of $142 and $228 (Note 5) Inventories Other current assets Total current assets Property, plant, and equipment, net Long-term investments Long-term financing receivables, net of allowance of $47 and $93 (Note 5) Goodwill Intangible assets, net Due from related party, net Other non-current assets Total assets Current liabilities: Short-term debt Accounts payable Due to related party Accrued and other Short-term deferred revenue Total current liabilities Long-term debt Long-term deferred revenue 28-Jan-22 29-Jan-21 31-Jan-20 $ 9,477 12,912 $ 14,201 $ 9,302 12,788 12,484 131 5,089 5,155 4,895 5,898 3,402 3,281 11,526 8,021 6,906 $ 45,043 $ 43,567 $ 36,868 5,415 6,431 6,055 1,839 1,624 864 5,522 5,339 4,848 19,770 40,829 41,691 7,461 14,429 18,107 710 6,985 11,196 10,428 92,735 $ 123,415 $ 118,861 5,823 6,362 7,737 27,143 21,696 20,065 1,414 7,578 9,549 9,773 14,267 16,525 14,881 $ 56,219 $ 54,132 $ 52,456 21,131 41,622 44,319 13,312 14,276 12,919 3,653 5,360 5,383 $ 94,315 $ 115,390 $ 115,077 Other non-current liabilities Total liabilities Commitments and contingencies (Note 11) Redeemable shares (Note 17) Stockholders' equity (deficit): Common stock and capital in excess of $0.01 par value (Note 14) Treasury stock at cost Accumulated deficit 472 629 7,898 16,849 16,091 (964) (305) (65) (8,188) (13,751) (16,891) Accumulated other comprehensive loss Total Dell Technologies Inc. stockholders' equity (deficit) (431) 105 (314) (709) 2,479 (1,574) Non-controlling interests 5,074 4,729 Total stockholders' equity (deficit) $ (1,580.00) $ 7,553 $ 3,155 Total liabilities, redeemable shares, and stockholders' equity $ 92,735 123,415 $ 118,861 File Preview Dell Technologies Inc. CONSOLIDATED STATEMENTS OF CASH FLOWS - USD ($) $ in Millions 28-Jan-22 12 Months Ended 29-Jan-21 21-Jan-20 Cash flows from operating activities: Net income $ 5,707 $ 3,505 $ 5,529 Adjustments to reconcile net income (loss) to net cash provided by operating activities: Depreciation and amortization 4,551 5,390 6,143 Stock-based compensation expense 1,622 1,609 1,262 Deferred income taxes (365) (399) (6,339) Other, net Changes in assets and liabilities, net of effects from acquisitions and dispositions: (3,130) (88) 938 Accounts receivable Financing receivables Inventories Other assets and liabilities Accounts payable (2,193) (396) (286) (241) (728) (1,329) (2,514) (243) 311 (1,948) (1,656) (1,559) 5,742 1,598 894 Deferred revenue 2,597 2,815 3,727 Change in cash from operating activities $ 10,307 $ 11,407 $ 9,291 Cash flows from investing activities: Purchases of investments Maturities and sales of investments Acquisition of businesses and assets, net (414) 513 (338) (181) 169 497 Capital expenditures and capitalized software development costs (2,796) (2,082) (2,576) (16) (424) (2,463) Other Repurchases of parent common stock Divestitures of businesses and assets, net Change in cash from investing activities Cash flows from financing activities: Dividends paid to VMware, Inc.'s public stockholders Proceeds from the issuance of common stock Repurchases of subsidiary common stock 3,957 2,187 (3) 62 28 40 $ 1,306 $ (460) $ (4,686) (2,240) 0 0 334 452 658 (663) (241) (8) (1,175) (1,363) (3,547) Proceeds from debt 20,425 16,391 20,481 Repayments of debt (26,723) (20,919) (22,117) Other (1,515) (270) (71) Change in cash from financing activities (16,609) (5,950) (4,604) Effect of exchange rate changes on cash, cash equivalents, and restricted cash Change in cash, cash equivalents, and restricted cash (106) 36 (90) (5,102) 5,033 (89) Cash, cash equivalents, and restricted cash at beginning of the period 15,184 10,151 10,240 Cash, cash equivalents, and restricted cash at end of the period 10,082 15,184 10,151 Income tax paid 1,257 1,421 1,414 Interest paid 1,825 2,279 2,500 Analyzing the Ratios You will be working with the Income Statement, Balance Sheet, and Cash Flow Statement of Dell Technologies, Inc. Working with the attached Excel spreadsheet, you are to determine the profitability, solvency, and liquidity ratios for Dell Technologies, Inc for the years 2022 and 2021. All the data, as well as a template, are provided to you within the spreadsheet. NOTE: The spreadsheet is "color-coded" to help you find the necessary line items within the Financial Statements. Once you have calculated the ratios, you will submit an APA formatted paper and include the following: Excel Worksheet: M7 - Ratios for Dell-Profitability-Solvency-Liquidity 2022.xlsx Dell Technologies, Inc. FREE CASH FLOW STATEMENT 2022, 2021, 2020 All Data is in Millions Free Cash Flow Calculation: Cash Flow from Operations: Less: Capital Expenditures: Free Cash Flow: $ 2022 2021 2020 Place the Capital Expenditures number within the cell as it appears within the Cash Flows Statement. Meaning...if it is a negaive number, copy it to this cell as a negative number. File Preview Dell Technologies Inc. CONSOLIDATED STATEMENTS OF FINANCIAL POSITION - USD ($) $ in Millions Current assets: Cash and cash equivalents Accounts receivable, net of allowance of $90 and $99 (Note 20) Due from related party, net Short-term financing receivables, net of allowance of $142 and $228 (Note 5) Inventories Other current assets Total current assets Property, plant, and equipment, net Long-term investments Long-term financing receivables, net of allowance of $47 and $93 (Note 5) Goodwill Intangible assets, net Due from related party, net Other non-current assets Total assets Current liabilities: Short-term debt Accounts payable Due to related party Accrued and other Short-term deferred revenue Total current liabilities Long-term debt Long-term deferred revenue 28-Jan-22 29-Jan-21 31-Jan-20 $ 9,477 12,912 $ 14,201 $ 9,302 12,788 12,484 131 5,089 5,155 4,895 5,898 3,402 3,281 11,526 8,021 6,906 $ 45,043 $ 43,567 $ 36,868 5,415 6,431 6,055 1,839 1,624 864 5,522 5,339 4,848 19,770 40,829 41,691 7,461 14,429 18,107 710 6,985 11,196 10,428 92,735 $ 123,415 $ 118,861 5,823 6,362 7,737 27,143 21,696 20,065 1,414 7,578 9,549 9,773 14,267 16,525 14,881 $ 56,219 $ 54,132 $ 52,456 21,131 41,622 44,319 13,312 14,276 12,919 3,653 5,360 5,383 $ 94,315 $ 115,390 $ 115,077 Other non-current liabilities Total liabilities Commitments and contingencies (Note 11) Redeemable shares (Note 17) Stockholders' equity (deficit): Common stock and capital in excess of $0.01 par value (Note 14) Treasury stock at cost Accumulated deficit 472 629 7,898 16,849 16,091 (964) (305) (65) (8,188) (13,751) (16,891) Accumulated other comprehensive loss Total Dell Technologies Inc. stockholders' equity (deficit) (431) 105 (314) (709) 2,479 (1,574) Non-controlling interests 5,074 4,729 Total stockholders' equity (deficit) $ (1,580.00) $ 7,553 $ 3,155 Total liabilities, redeemable shares, and stockholders' equity $ 92,735 123,415 $ 118,861 File Preview Dell Technologies Inc. CONSOLIDATED STATEMENTS OF CASH FLOWS - USD ($) $ in Millions 28-Jan-22 12 Months Ended 29-Jan-21 21-Jan-20 Cash flows from operating activities: Net income $ 5,707 $ 3,505 $ 5,529 Adjustments to reconcile net income (loss) to net cash provided by operating activities: Depreciation and amortization 4,551 5,390 6,143 Stock-based compensation expense 1,622 1,609 1,262 Deferred income taxes (365) (399) (6,339) Other, net Changes in assets and liabilities, net of effects from acquisitions and dispositions: (3,130) (88) 938 Accounts receivable Financing receivables Inventories Other assets and liabilities Accounts payable (2,193) (396) (286) (241) (728) (1,329) (2,514) (243) 311 (1,948) (1,656) (1,559) 5,742 1,598 894 Deferred revenue 2,597 2,815 3,727 Change in cash from operating activities $ 10,307 $ 11,407 $ 9,291 Cash flows from investing activities: Purchases of investments Maturities and sales of investments Acquisition of businesses and assets, net (414) 513 (338) (181) 169 497 Capital expenditures and capitalized software development costs (2,796) (2,082) (2,576) (16) (424) (2,463) Other Repurchases of parent common stock Divestitures of businesses and assets, net Change in cash from investing activities Cash flows from financing activities: Dividends paid to VMware, Inc.'s public stockholders Proceeds from the issuance of common stock Repurchases of subsidiary common stock 3,957 2,187 (3) 62 28 40 $ 1,306 $ (460) $ (4,686) (2,240) 0 0 334 452 658 (663) (241) (8) (1,175) (1,363) (3,547) Proceeds from debt 20,425 16,391 20,481 Repayments of debt (26,723) (20,919) (22,117) Other (1,515) (270) (71) Change in cash from financing activities (16,609) (5,950) (4,604) Effect of exchange rate changes on cash, cash equivalents, and restricted cash Change in cash, cash equivalents, and restricted cash (106) 36 (90) (5,102) 5,033 (89) Cash, cash equivalents, and restricted cash at beginning of the period 15,184 10,151 10,240 Cash, cash equivalents, and restricted cash at end of the period 10,082 15,184 10,151 Income tax paid 1,257 1,421 1,414 Interest paid 1,825 2,279 2,500 Analyzing the Ratios You will be working with the Income Statement, Balance Sheet, and Cash Flow Statement of Dell Technologies, Inc. Working with the attached Excel spreadsheet, you are to determine the profitability, solvency, and liquidity ratios for Dell Technologies, Inc for the years 2022 and 2021. All the data, as well as a template, are provided to you within the spreadsheet. NOTE: The spreadsheet is "color-coded" to help you find the necessary line items within the Financial Statements. Once you have calculated the ratios, you will submit an APA formatted paper and include the following: Excel Worksheet: M7 - Ratios for Dell-Profitability-Solvency-Liquidity 2022.xlsx
Expert Answer:

Related Book For 

Fundamentals Of Corporate Finance
ISBN: 9780135811603
5th Edition
Authors: Jonathan Berk, Peter DeMarzo, Jarrad Harford
Posted Date:
Students also viewed these accounting questions
-
Read the case study "Southwest Airlines," found in Part 2 of your textbook. Review the "Guide to Case Analysis" found on pp. CA1 - CA11 of your textbook. (This guide follows the last case in the...
-
BACKGROUND You are an information analyst working for NEE. The company president has asked you to prepare a Quantitative analysis of financial, sales, and operations data to help determine which...
-
Obtain the transfer functions X(s)/F(s) and Y(s)/F(s) for the following model: 3x = y y = f(t) -3y- 15x
-
Compare and contrast intensive, selective, and exclusive distribution. Which channel design decision does this involve?
-
A structure known as a cantilever beam is clamped at one end but free at the other, analogous to a diving board that supports a swimmer standing on it (Figure P3.28). Using the following procedure,...
-
How might a hacker access and manipulate a digital device for illegal purposes? Are the Internet of Things (IoT) devices at risk for hacker access and manipulation?
-
On June 1, 2012, Andre Company and Agassi Company merged to form Lancaster Inc. A total of 800,000 shares were issued to complete the merger. The new corporation reports on a calendar-year basis. On...
-
3. Market demand is given by: 100-Q, P(Q) = if Q <100 otherwise Suppose there are two firms both with constant marginal cost 50 and no fixed cost and capacity constraint. Assume that firms produce...
-
How to solve C language problems?
-
Write a program to calculate Body Mass Index (BMI) given a person's height and weight. Use previousassignments and demo programs as models. Create a new project called03.05Body Mass Index in your...
-
A retired couple invested $ 1 2 0 0 0 in bonds at a simple interest rate of 8 % . At the end of one year, how much interest did they receive on their investment?
-
Identify and explain the significance of chicanos creating a homeland in the american southwest in the late 1 9 6 0 s
-
American Baptist Home Mission Societies partners with American Baptists to promote Christian faith, cultivate Christ-centered leaders and disciples, and bring healing and transformation to...
-
An economy depends on two commodities, bees and honey. It takes 3 4 units of bees to produce 1 unit of honey and 1 2 unit of honey to produce 1 unit of bees. Find the production required to satisfy a...
-
1-Suppose that you purchase a 182-day Treasury bill for S9,850 that is worth S10,000 when it matures. What is security's annualized investment rate if held to maturity.? 2- A) The annualized rate on...
-
Write a paper about medication error system 2016.
-
Consider the following potential events that might have occurred to Global on December30, 2019. For each one, indicate which line items in Globals balance sheet would be affected and by how much....
-
If you own 15,000 shares of stock of Nike and it pays a dividend of $0.21 per share, then what is the total dividend you will receive?
-
You manage a (tax-free) pension fund that is invested in KOA Corporation. KOAs managers have just announced that they unexpectedly generated an extra $50 millionin cash flow this year. They are...
-
Fill in the blanks to make the following statements correct. a. Economists have designed____________ to better explain and predict the behaviour we observe in the world around us. b. A variable, such...
-
The following supply and demand schedules describe a hypothetical Canadian market for potash. a. What is the equilibrium price of potash? b. How much potash would actually be purchased if the price...
-
According to Statistics Canada, Canada's exports and imports of energy (combined totals of fossil fuels, hydro, and nuclear, all measured in petajoules) over a five-year period were as follows: a....

Study smarter with the SolutionInn App