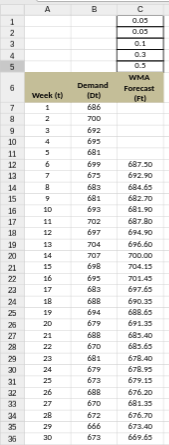
Question: Demand data for thirty days have been provided, along with computed weighted moving average forecasts for days six to thirty, using weights of 0.5, 0.3,

Demand data for thirty days have been provided,Demand data for thirty days have been provided,

Demand data for thirty days have been provided, along with computed weighted moving average forecasts for days six to thirty, using weights of 0.5, 0.3, 0.1, 0.05, and 0.05, with the largest weight on most recent demand. Please compute the Mean Suared Error (MSE) for the 25 forecasts, and then use SOLVER to find the five weights that will minimize the MSE. Note that your weights must sum to one, and it is OK for some of the weights to be zero. Report your new (optimized) value for the MSE, to two decimals. Workbook A B 1 2 a 4 5 0.05 0.05 0.1 0.3 6 WMA Forecast Ft) Week (t) 7 8 9 10 11 12 12 14 15 16 17 18 19 2 3 4 5 6 7 8 9 10 12 20 21 13 14 15 Demand (DE) 686 700 692 695 681 699 675 683 681 693 702 697 704 707 69B 695 683 688 694 679 688 670 681 679 673 688 670 672 666 673 17 18 19 20 22 22 24 25 26 27 28 29 30 31 687.30 692.90 684.65 682.70 681.90 687.80 694.90 696.60 700.00 704.15 701.45 697.65 690.35 688.65 691.35 685.40 685.65 678.40 678.95 679.15 676.20 681.35 676.70 673.40 669.65 21 22 23 22 24 25 26 27 28 29 30 35

Step by Step Solution

There are 3 Steps involved in it

1 Expert Approved Answer
Step: 1 Unlock blur-text-image
Question Has Been Solved by an Expert!

Get step-by-step solutions from verified subject matter experts

Step: 2 Unlock
Step: 3 Unlock

Students Have Also Explored These Related General Management Questions!