

Question: Demand Estimation Overview: I have collected real data on the sale of a microwavable cup of soup across 20 different cities for the same time


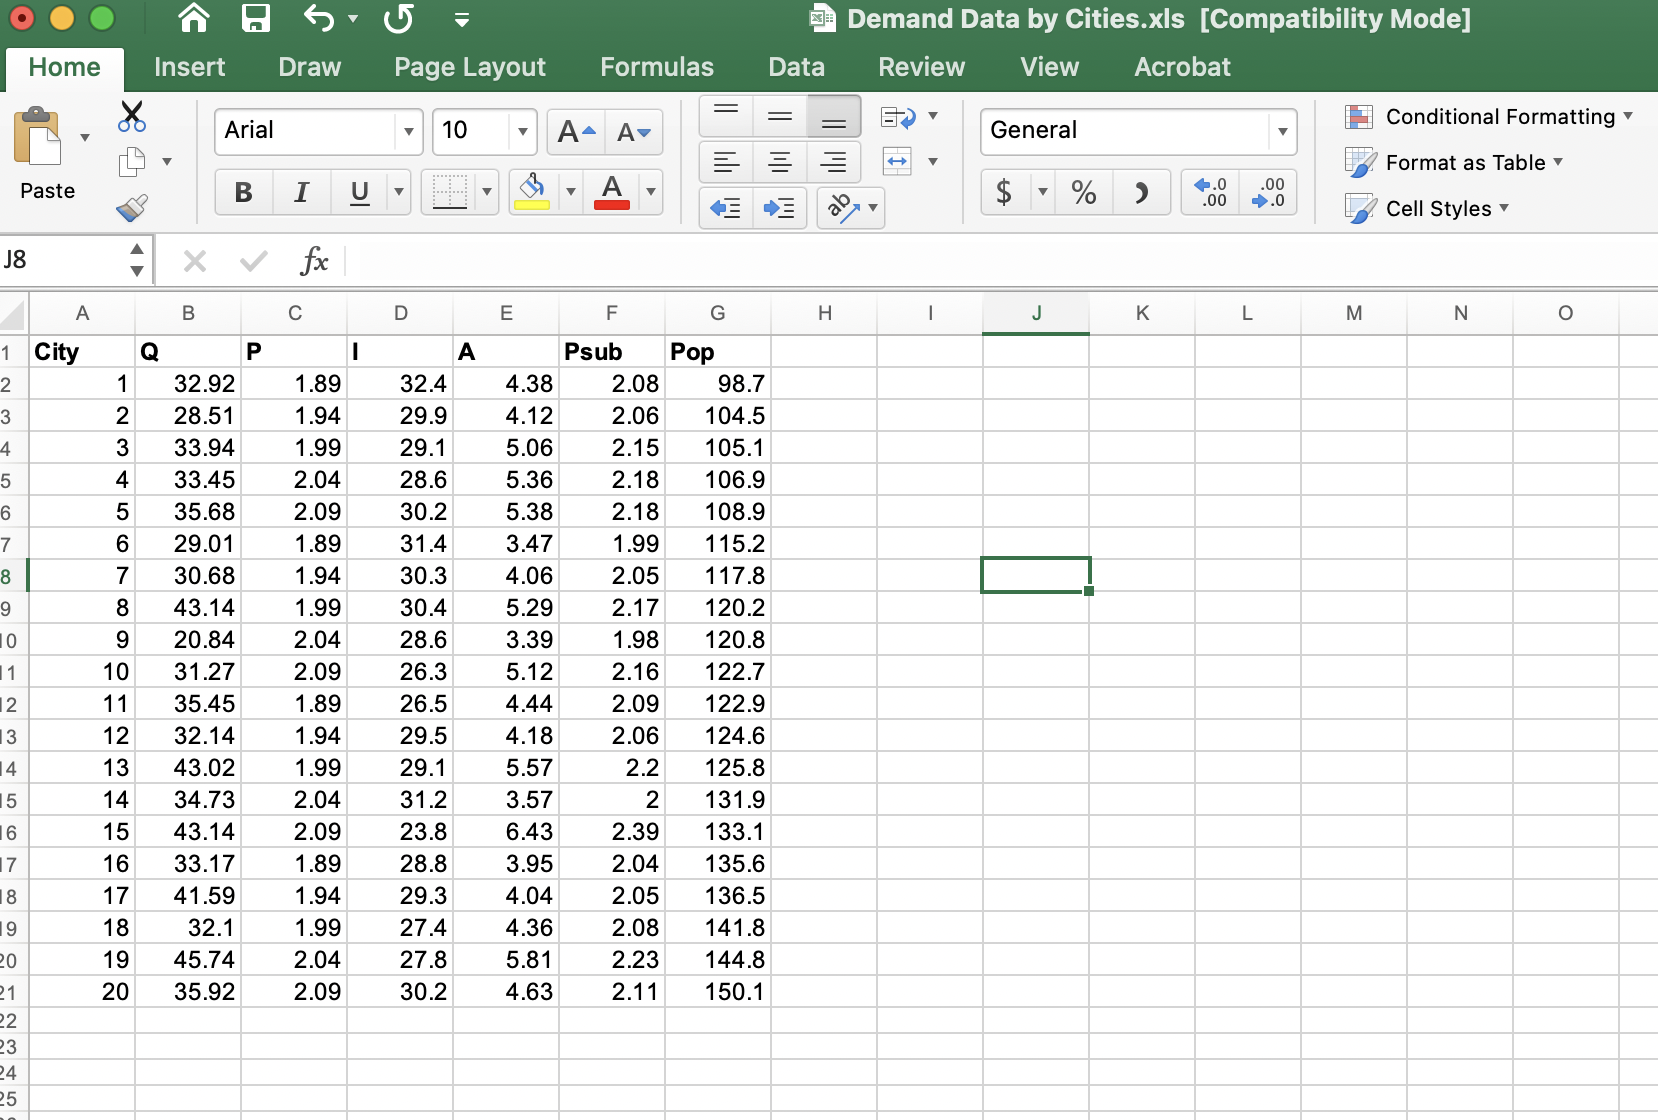
Demand Estimation Overview: I have collected real data on the sale of a microwavable cup of soup across 20 different cities for the same time period (a month). The variables in the dataset are: Quantity sold in the city for that month: Measured in thousands of units Price: measured in dollars Average Income in the city: MeaSured in thOusands of dollars Ads: Average number of ads run in stores for that city during that month. Price of a substitute product: measured in dollars Population of the city: meaSured in thOusands of people The dataset is on Canvas and, using Excel or any other statistical software, please answer the following questions: 1. Describe the patterns in quantity sold and own and rival prices during this time period using basic descriptive statistics. Graphs are welcome as well. 2. Take the logs of the variables, and estimate the demand function. a. Interpret the Rsquare. b. Interpret the coefcients for lgglg'and lgglsgb, c. Interpret the p-values associated with each independent variable 3. Are consumers price sensitive? Why or why not? (be as precise as you can you have estimatesl). Does this price sensitivity make sense given the good we are examining? 4. How sensitive are Our consumers to changes in the rival good's price? Explain in detail. 5. Suppose we decide to charge a per Ounce price of 352, while at the same time our rival charges a price of $2.15. All else equal, what w0uld y0u expect sales to be? How condent are you in your forecast? Explain. 6. Suppose we are charging a price of $2 and our current marginal cost is $1.50 Are we maximizing prots at this price? If not, should we raise or lower price? Why? A few notes: Do not turn in the dataset itself I already know it. Try to produce a polished report: have well labeled and presented graphs and tables, and refer to them in y0ur answers. Be sure to answer all aspects of the questions do not leave parts unanswered. OO Demand Data by Cities.xIs [Compatibility Mode] Home Insert Draw Page Layout Formulas Data Review View Acrobat Arial 10 A- A = General Conditional Formatting = Format as Table Paste B I U A $ % 1.0 .00 .00 .0 Cell Styles 18 X V fx A B C D E F G H J K L M N O City Q P A Psub Pop 32.92 1.89 32.4 4.38 2.08 98.7 28.51 1.94 29.9 4.12 2.06 104.5 33.94 1.99 29.1 5.06 2.15 105.1 J O UA W N- 33.45 2.04 28.6 5.36 2.18 106.9 35.68 2.09 30.2 5.38 2.18 108.9 29.01 1.89 31.4 3.47 1.99 115.2 30.68 1.94 30.3 4.06 2.05 117.8 43.14 1.99 30.4 5.29 2.17 120.2 20.84 2.04 28.6 3.39 1.98 120.8 10 31.27 2.09 26.3 5.12 2.16 122.7 11 35.45 1.89 26.5 4.44 2.09 122.9 12 32.14 1.94 29.5 4.18 2.06 124.6 13 43.02 1.99 29.1 5.57 2.2 125.8 14 34.73 2.04 31.2 3.57 2 131.9 15 43.14 2.09 23.8 6.43 2.39 133.1 16 33.17 1.89 28.8 3.95 2.04 135.6 17 41.59 1.94 29.3 4.04 2.05 136.5 CO 18 32.1 1.99 27.4 4.36 2.08 141.8 19 45.74 2.04 27.8 5.81 2.23 144.8 20 35.92 2.09 30.2 4.63 2.11 150.1
Step by Step Solution
There are 3 Steps involved in it

Get step-by-step solutions from verified subject matter experts