

Question: Demand for Meth 3. Figure 4 shows the demand for meth in East $founee Figure 4 Egg. Current sanctions are shown as pas on the
Demand for Meth
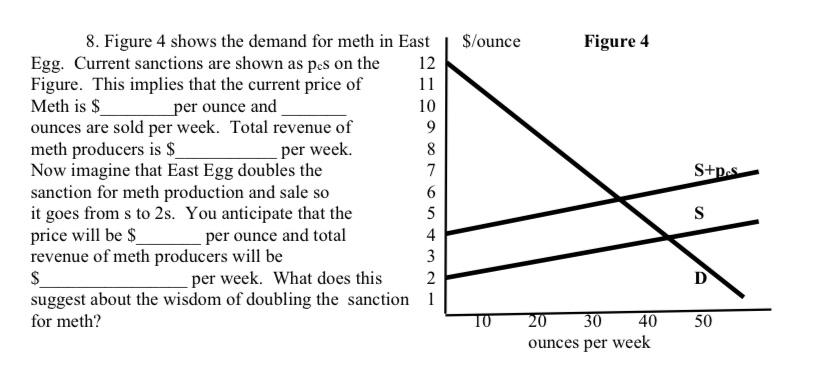
3. Figure 4 shows the demand for meth in East $founee Figure 4 Egg. Current sanctions are shown as pas on the 12 Figure. This implies that the current price of l l Meth is $ per ounce and It] ounces are sold per week. Total revenue of 9 meth producers is $ per week. 3 Now imagine that East Egg doubles the T sanction for meth production and sale so 6 it goes from s to 25. You anticipate that the 5 price will be $ per ounce and total 4 revenue of meth producers will he 3 $ per week. What does this 2 suggest about the wisdom of doubling the sanction l for meth'? 41:} ounces per week
Step by Step Solution
There are 3 Steps involved in it
1 Expert Approved Answer
Step: 1 Unlock

Question Has Been Solved by an Expert!
Get step-by-step solutions from verified subject matter experts
Step: 2 Unlock
Step: 3 Unlock