

Question: Demand for the services is estimated to be Qa = 6,000 - 20P. Joe the Plumber's willingness to supply is represented by Qs = 30P
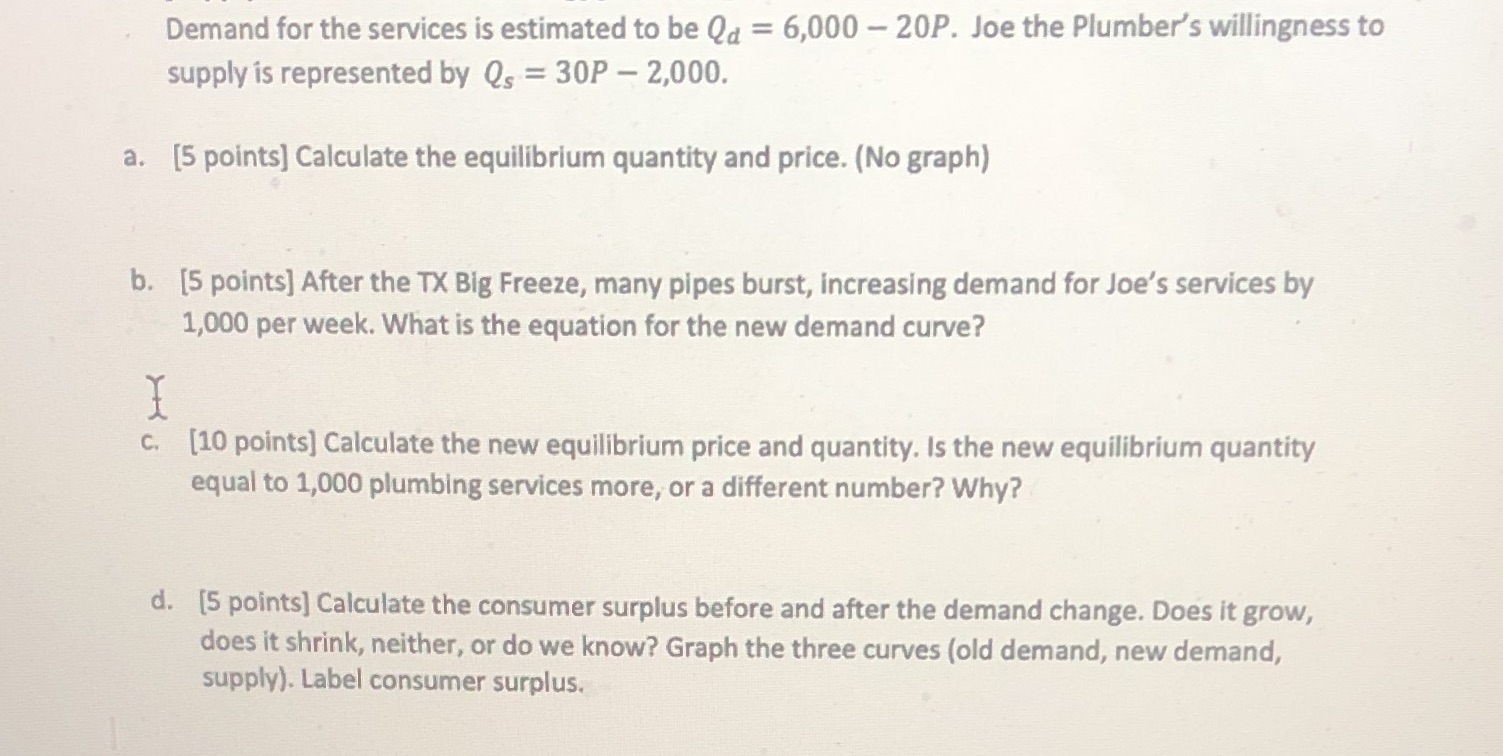
Demand for the services is estimated to be Qa = 6,000 - 20P. Joe the Plumber's willingness to supply is represented by Qs = 30P - 2,000. a. [5 points] Calculate the equilibrium quantity and price. (No graph) b. [5 points] After the TX Big Freeze, many pipes burst, increasing demand for Joe's services by 1,000 per week. What is the equation for the new demand curve? c. [10 points] Calculate the new equilibrium price and quantity. Is the new equilibrium quantity equal to 1,000 plumbing services more, or a different number? Why? d. [5 points] Calculate the consumer surplus before and after the demand change. Does it grow, does it shrink, neither, or do we know? Graph the three curves (old demand, new demand, supply). Label consumer surplus
Step by Step Solution
There are 3 Steps involved in it

Get step-by-step solutions from verified subject matter experts