

Question: Demand for widgets follow the probability distribution shown: Stock is examined every 7 days ( the plant is in operation every day ) and if
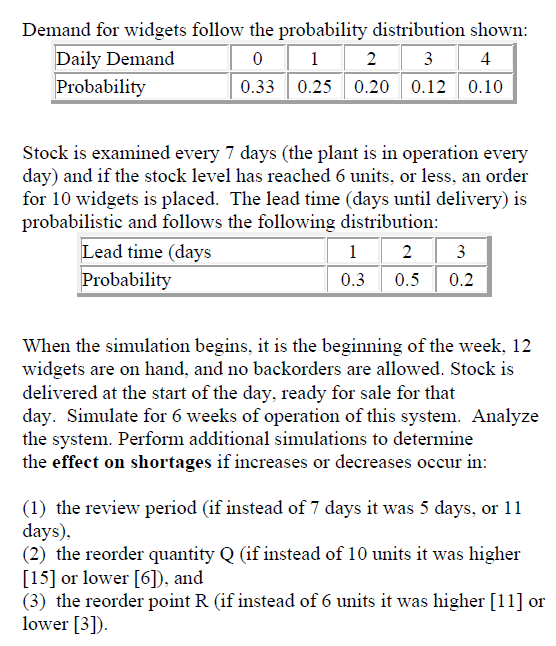
Demand for widgets follow the probability distribution shown:
Stock is examined every days the plant is in operation every
day and if the stock level has reached units, or less, an order
for widgets is placed. The lead time days until delivery is
probabilistic and follows the following distribution:
When the simulation begins, it is the beginning of the week,
widgets are on hand, and no backorders are allowed. Stock is
delivered at the start of the day, ready for sale for that
day. Simulate for weeks of operation of this system. Analyze
the system. Perform additional simulations to determine
the effect on shortages if increases or decreases occur in:
the review period if instead of days it was days, or
days
the reorder quantity Q if instead of units it was higher
or lower and
the reorder point if instead of units it was higher or
lower
Step by Step Solution
There are 3 Steps involved in it
1 Expert Approved Answer
Step: 1 Unlock

Question Has Been Solved by an Expert!
Get step-by-step solutions from verified subject matter experts
Step: 2 Unlock
Step: 3 Unlock