

Question: Demand Forecasting: Quarter 1 Year 2007 2007 2 2007 3 2007 4 Total Demand in 2007 2008 1 2008 2 2008 3 2008 4 Total
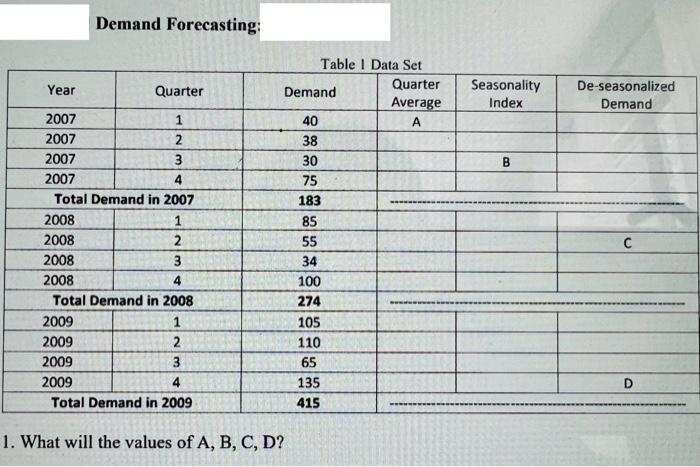
Demand Forecasting: Quarter 1 Year 2007 2007 2 2007 3 2007 4 Total Demand in 2007 2008 1 2008 2 2008 3 2008 4 Total Demand in 2008 2009 1 2009 2 2009 3 2009 Total Demand in 2009 1. What will the values of A, B, C, D? Table 1 Data Set Demand 40 38 30 75 183 85 55 34 100 274 105 110 65 135 415 Quarter Average A Seasonality Index B De-seasonalized Demand C D
Step by Step Solution
There are 3 Steps involved in it
1 Expert Approved Answer
Step: 1 Unlock

Question Has Been Solved by an Expert!
Get step-by-step solutions from verified subject matter experts
Step: 2 Unlock
Step: 3 Unlock