Question: Demand = Y = demand for a large size bottle of Fresh (in 100,000) Price = the price of Fresh as offered by Ent. Industries
Demand = Y = demand for a large size bottle of Fresh (in 100,000)
Price = the price of Fresh as offered by Ent. Industries AIP = the average industry price ADV = Ent. Industries Advertising Expenditure (in $100,000) to Promote Fresh in the sales period. DIFF = AIP - Price = the "price difference" in the sales period
1.Use 3-month and 6-month moving averages to predict the demand for January 2021. Find MAD for both forecasts and identify the preferred one based on each calculation. Is the moving average suitable method for forecasting for this data set? Explain your reasoning.
2.Use Exponential smoothing forecasts with alpha of 0.1, 0.2, ..., 0.9 to predict January 2021 demand. Identify the value of alpha that results in the lowest MAD.
3.Find the monthly seasonal indices for the demand values using Simple Average (SA) method. Find the de-seasonalized demand values by dividing monthly demand by seasonal indices.
4.Use regression to perform trend analysis on the de-seasonalized demand values. Is trend analysis suitable for this data? Find MAD, the seasonally adjusted trend forecasts for January through March 2021 and explain the Excel Regression output (trend equation, r, r-squared, goodness of model).
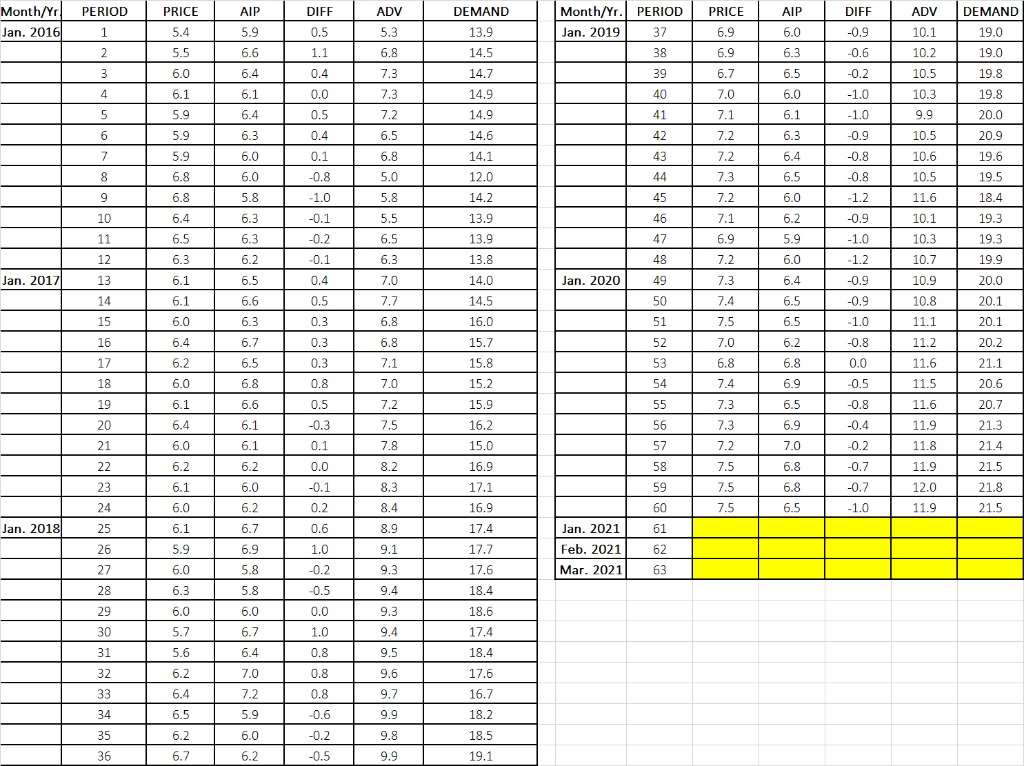
PRICE ADV AIP DIFF ADV Month/YR Jan. 2016 PERIOD 1 AIP 5.9 5.4 DIFF 0.5 1.1 5.3 DEMAND 13.9 14.5 Month/Yr. PERIOD Jan. 2019 37 38 PRICE 6.9 6.9 6.0 -0.9 10.1 10.2 DEMAND 19.0 19.0 2 5.5 6.6 6.8 6.3 -0.6 3 6.0 6.4 0.4 7.3 14.7 39 6.7 6.5 -0.2 10.5 4 6.1 6.1 7.3 40 7.0 -1.0 0.0 0.5 14.9 14.9 10.3 9.9 19.8 19.8 20.0 5 5.9 6.4 7.2 6.0 6.1 6.3 41 7.1 -1.0 6 5.9 6.3 0.4 6.5 14.6 42 7.2 -0.9 10.5 20.9 7 5.9 43 10.6 19.6 6.0 6.0 0.1 -0.8 6.8 5.0 14.1 12.0 7.2 7.3 6.4 6.5 -0.8 -0.8 8 6.8 44 10.5 19.5 9 6.8 -1.0 5.8 14.2 45 7.2 6.0 -1.2 11.6 18.4 10 6.4 5.8 6.3 6.3 -0.1 5.5 7.1 6.2 -0.9 10.1 19.3 13.9 13.9 46 47 11 6.5 6.5 6.9 5.9 -1.0 10.3 19.3 -0.2 -0.1 12 6.3 6.2 6.3 13.8 48 7.2 6.0 -1.2 10.7 19.9 Jan. 2017) 13 0.4 7.0 Jan. 2020 49 7.3 6.4 -0.9 10.9 6.1 6.1 6.0 7.7 50 14.0 14.5 16.0 14 15 -0.9 10.8 0.5 0.3 7.4 7.5 6.5 6.5 6.8 51 -1.0 11.1 6.5 6.6 6.3 6.7 6.5 6.8 6.4 0.3 52 7.0 6.2 -0.8 16 17 6.8 7.1 11.2 11.6 20.0 20.1 20.1 20.2 21.1 20.6 20.7 15.7 15.8 15.2 6.2. 0.3 53 6.8 6.8 0.0 18 6.0 0.8 7.0 54 7.4 6.9 -0.5 11.5 19 6.6 0.5 15.9 55 7.3 6.5 11.6 6.1 6.4 7.2 7.5 20 6.1 16.2 56 6.9 -0.3 0.1 21.3 -0.8 -0.4 -0.2 7.3 7.2 11.9 11.8 21 6.0 6.1 7.8 15.0 7.0 21.4 57 58 22 6.2 8.2 16.9 7.5 6.8 0.0 -0.1 6.2 6.0 6.2 -0.7 -0.7 11.9 12.0 6.1 8.3 17.1 59 23 24 25 6.8 7.5 7.5 21.5 21.8 21.5 6.0 0.2 8.4 60 6.5 -1.0 11.9 16.9 17.4 Jan. 2018 6.7 0.6 8.9 61 26 6.1 5.9 6.0 6.9 1.0 9.1 17.7 17.6 Jan. 2021 Feb. 2021 Mar. 2021 62 27 -0.2 9.3 63 28 6.3 -0.5 9.4 18.4 29 6.0 5.8 5.8 6.0 6.7 6.4 18.6 30 5.7 0.0 1.0 0.8 9.3 9.4 9.5 31 5.6 32 6.2 0.8 9.6 7.0 7.2 17.4 18.4 17.6 16.7 18.2 18.5 33 9.7 6.4 6.5 0.8 -0.6 34 5.9 9.9 6.2 6.0 35 36 -0.2 -0.5 9.8 9.9 6.7 6.2 19.1


