

Question: Demonstrate your ability to use the Statistical Package for the Social Sciences (SPSS) software to perform statistical analysis of a data set. You can view
Demonstrate your ability to use the Statistical Package for the Social Sciences (SPSS)
software to perform statistical analysis of a data set.
You can view the description of the datasets and download the relevant dataset Excel
spreadsheet from the Assessment 3 folder of this subject.
While recording the process using screen capture, execute the following statistical processes
in SPSS using the following sequence:
1. Generate a boxplot for group A and group B to check for data outliers and remove
any outliers from your subsequent analysis, if present.
2. Create frequency histogram for group A and group B to check the distribution of
the data and decide which parametric or non-parametric test is appropriate to
compare the two groups.
3. Use the appropriate normality test to determine the distribution of groups A and B,
and use the correct inferential statistical test to compare the two groups. Decide if
there is a significant difference in the measure of central tendency for the two
groups.
Write the abstract to report the findings of Part 1. This should include:
1. Aim: one or two sentences describing the purpose of the research study; a short
background to the study is included with each data set.
2. Methods: describe which statistical methods were applied in SPSS
3. Results: report the key summary statistics and P value using conventions required for
formal reporting of statistical results
4. Conclusion: briefly describe the significance of your results
Please solve this.
data link - https://drive.google.com/file/d/1hiu6Pz2LwCvwdwIb7pL7wNB7WfZWcNp0/view?usp=sharing
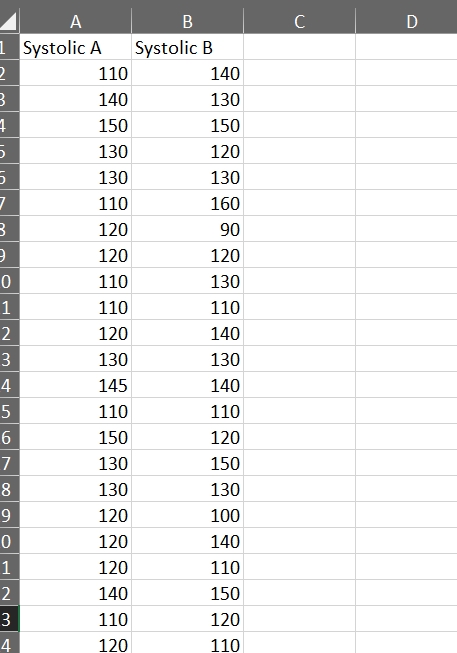
A B C D 1 Systolic A Systolic B 110 140 140 130 150 150 130 120 130 130 110 160 120 90 120 120 0 110 130 110 110 2 120 140 3 130 130 4 145 140 5 110 110 6 150 120 130 150 8 130 130 120 100 120 140 INPOD 120 110 140 150 3 110 120 4 120 110
Step by Step Solution
There are 3 Steps involved in it

Get step-by-step solutions from verified subject matter experts