

Question: Demonstration of datatype error/precision utilizing convergence: Given x ranging from 0 to 2*pi at an interval of pi/16, demonstrate using Matlab a table (disp or
Demonstration of datatype error/precision utilizing convergence:
Given x ranging from 0 to 2*pi at an interval of pi/16, demonstrate using Matlab a table (disp or sprintf) and a plot of n iterations as a function of x. Include the results for double and single precision. Save your .m file and publish the .pdf to your drop folder on the L: Drive.
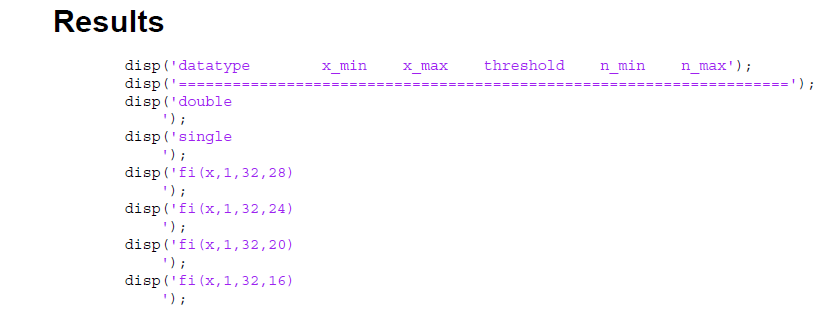
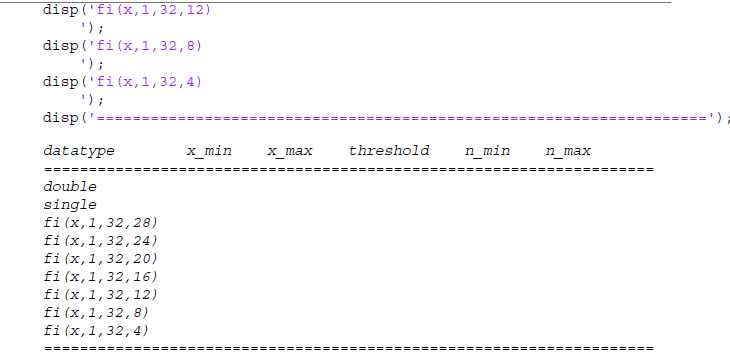
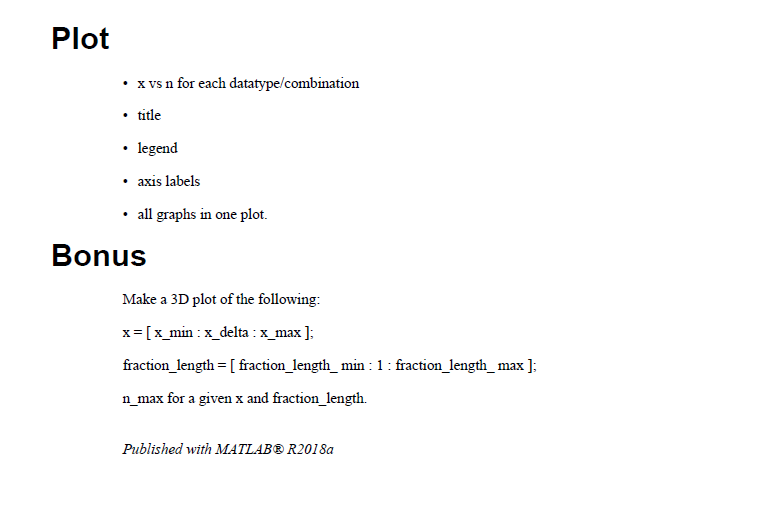
Results disp('datatype x_min x_max threshold n_minn_max'); disp('===================================================================='); disp('double '); disp('single '); disp('fi(x,1,32,28) '); disp('fi(x,1,32,24) disp('fi(x,1,32,20) disp('fi(x,1,32,16) disp('fi(x,1,32,12) '); disp('fi(x,1,32,8) disp('fi(x, 1, 32,4) disp('==== ====') datatype x_min x_max threshold n_min n_max = = = = = = = = = = == == = = == = = == = = == = = = = = = = = = = = = = = = = = = = = = = = = = double single fi(x,1, 32,28) fi(x,1, 32, 24) fi(x,1, 32, 20) fi(x,1, 32,16) fi(x,1, 32,12) fi (x, 1, 32,8) fi(x,1,32,4) = = = = = = = = = = = = = = = = = = = = == = = = = = = = = = = = = = = = = = = = = = = = = = = = = = = == = = = = = = = = = = = = = = Plot xvs n for each datatype/combination . title legend axis labels all graphs in one plot. Bonus Make a 3D plot of the following: x=[x_min : x_delta : x_max]; fraction_length = [ fraction_length_min : 1: fraction_length_max ); n_max for a given x and fraction_length. Published with MATLABR2018a Results disp('datatype x_min x_max threshold n_minn_max'); disp('===================================================================='); disp('double '); disp('single '); disp('fi(x,1,32,28) '); disp('fi(x,1,32,24) disp('fi(x,1,32,20) disp('fi(x,1,32,16) disp('fi(x,1,32,12) '); disp('fi(x,1,32,8) disp('fi(x, 1, 32,4) disp('==== ====') datatype x_min x_max threshold n_min n_max = = = = = = = = = = == == = = == = = == = = == = = = = = = = = = = = = = = = = = = = = = = = = = double single fi(x,1, 32,28) fi(x,1, 32, 24) fi(x,1, 32, 20) fi(x,1, 32,16) fi(x,1, 32,12) fi (x, 1, 32,8) fi(x,1,32,4) = = = = = = = = = = = = = = = = = = = = == = = = = = = = = = = = = = = = = = = = = = = = = = = = = = = == = = = = = = = = = = = = = = Plot xvs n for each datatype/combination . title legend axis labels all graphs in one plot. Bonus Make a 3D plot of the following: x=[x_min : x_delta : x_max]; fraction_length = [ fraction_length_min : 1: fraction_length_max ); n_max for a given x and fraction_length. Published with MATLABR2018a
Step by Step Solution
There are 3 Steps involved in it

Get step-by-step solutions from verified subject matter experts