

Question: (a) What kind of display is this? Scatter chart Line chart Column chart with 3D visual effect Pie chart (b-1) Identify an improvement for
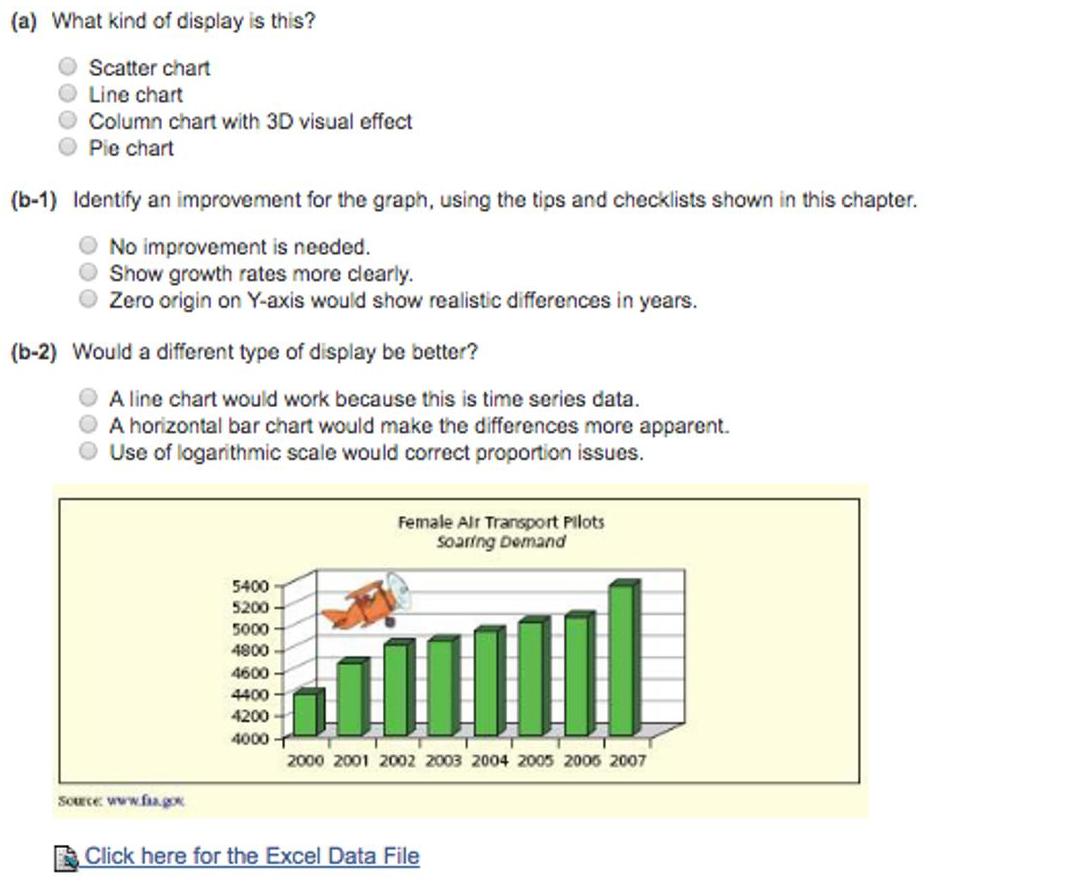

(a) What kind of display is this? Scatter chart Line chart Column chart with 3D visual effect Pie chart (b-1) Identify an improvement for the graph, using the tips and checklists shown in this chapter. No improvement is needed. Show growth rates more clearly. Zero origin on Y-axis would show realistic differences in years. (b-2) Would a different type of display be better? A line chart would work because this is time series data. A horizontal bar chart would make the differences more apparent. Use of logarithmic scale would correct proportion issues. Female Alr Transport Pilots Soaring Demand 5400 5200 5000 4800 4600 4400 4200 4000 T 2000 2001 2002 2003 2004 2005 2006 2007 Source www.fagox A Click here for the Excel Data File Sources of Medical Error Adverse Drug Effects Surgical Incidents Pationt Falls Nosocomial Infections 12 14 16 18 20 22 24 26 Click here for the Excel Data File (a) What kind of display is this? O Bar chart with 3D visual effect O Histogram O Column chart with 3D visual effect (b-1) Identify its strengths, using the tips and checklists shown in this chapter. (You may select more than one answer. Click the box with a check mark for the correct answer and double click to empty the box for the wrong answer.) 2 Good proportions 2 Clear title 2 No distracting pictures 2 Labels on X- and Y- axes 2 Source identified (b-2) Identify its weaknesses, using the tips and checklists shown in this chapter. (You may select more than one answer. Click the box with a check mark for the correct answer and double click to empty the box for the wrong answer.) 2 No labels on X- and Y- axes 2 3D effect does not add to presentation 2 Distracting pictures 2 Bad proportions 2 Title unclear (c) Can you suggest any improvements? Would a different type of display be better? O A line chart would be the preferred choice by most analysts. O A 2D bar chart with a zero origin on the X-axis would improve the chart.
Step by Step Solution
3.45 Rating (148 Votes )
There are 3 Steps involved in it
Solution Note Refer attached image for solution a Column ... View full answer

Get step-by-step solutions from verified subject matter experts