

Question: Describe and explain the cross-tab below using the concepts you learned about this term. For example report Epsilon and interpret the proportionate reduction in error
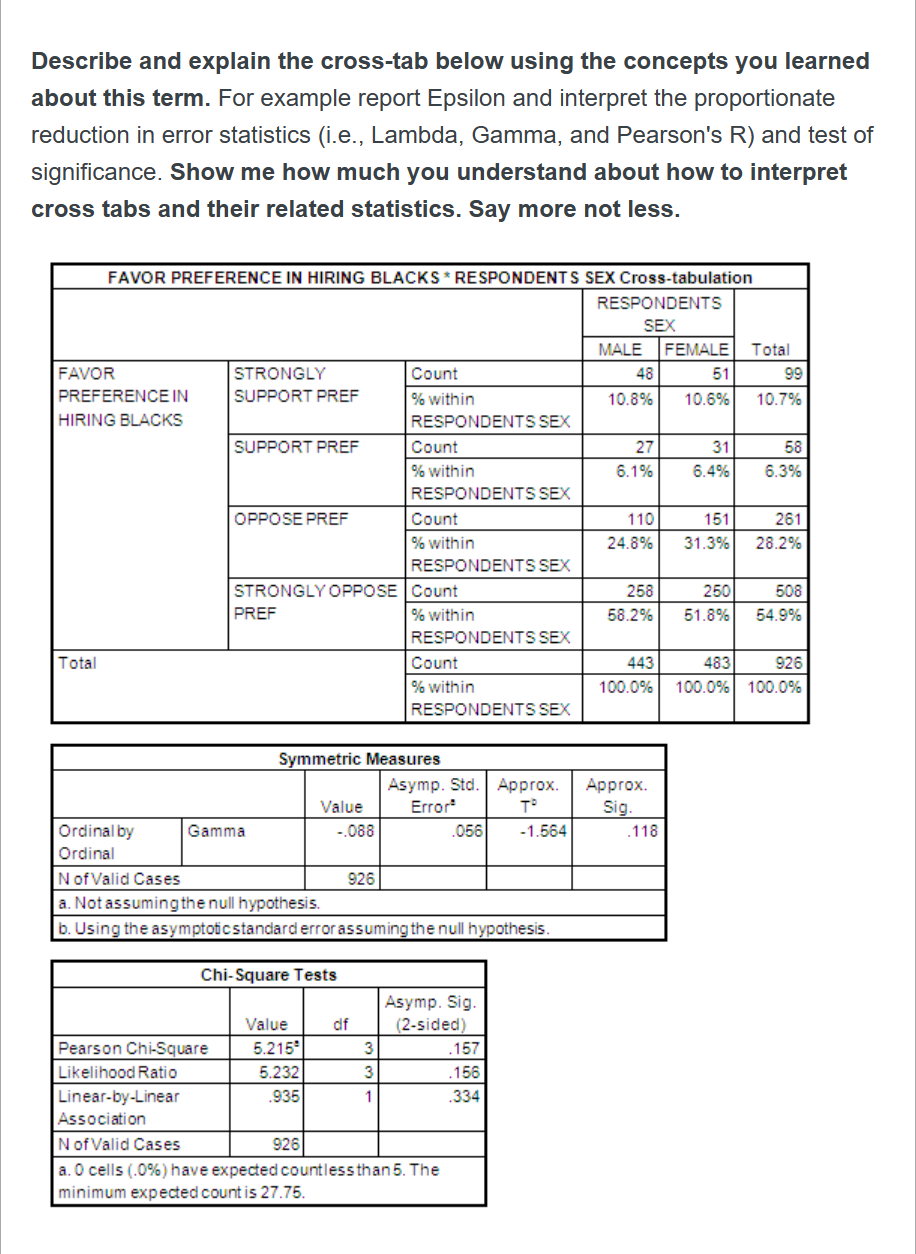
Describe and explain the cross-tab below using the concepts you learned about this term. For example report Epsilon and interpret the proportionate reduction in error statistics (i.e., Lambda, Gamma, and Pearson's R) and test of significance. Show me how much you understand about how to interpret cross tabs and their related statistics. Say more not less. FAVOR PREFERENCE IN HIRING BLACKS * RESPONDENT SEX Cross-tabulation RESPONDENTS SEX MALE |FEMALE| Total FAVOR STRONGLY 99 PREFERENCEIN SUPPORT PREF % within 10.8% 10.6%| 10.7% HIRING BLACKS RESPONDENTS SEX SUPPORT PREF % within 6.4% 6.3% RESPONDENTS SEX OPPOSE PREF % within 245%| 313%| 28.2% RESPONDENTS SEX STRONGLY OPPOSE PREF % within 55.2%| 6510%| 549% RESPONDENTS SEX % within 100.0% | 100.0%| 100.0% RESPONDENTS SEX Symmetric Measures Value Error Sig. Ordinal by Gamma -.0B8 056 -1.564 118 Ordinal [NofvalidCases | o2 | | | a. Not assumingthe null hypothesis. b. Using the asymptoticstandard errorassuming the null hypothesis. Chi-Square Tests _ .232 Linear-by-Linear 935 1 334 Association NofvalidCases | 926] [ | a.0 cells (.0%) have expectedcountlessthan5. The minimum expected count is 27.75
Step by Step Solution
There are 3 Steps involved in it

Get step-by-step solutions from verified subject matter experts