

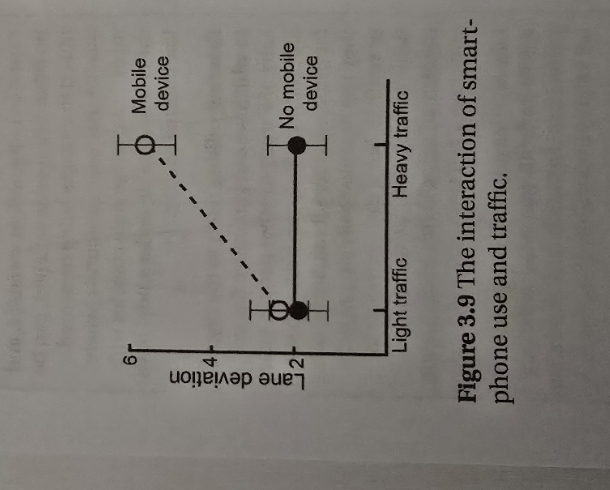
Question: Describe how the driving performance data in figure 3.9 in the text bookrepresents a two-way interaction and what the graph would look like withoutthe interaction.
Describe how the driving performance data in figure 3.9 in the text bookrepresents a two-way interaction and what the graph would look like withoutthe interaction.
Step by Step Solution
There are 3 Steps involved in it
1 Expert Approved Answer
Step: 1 Unlock

Question Has Been Solved by an Expert!
Get step-by-step solutions from verified subject matter experts
Step: 2 Unlock
Step: 3 Unlock