

Question: Describe how you could use this matrix to compute a 10-year cumulative default probability for the BB-rated bonds. What is the (cumulative) probability that a
- Describe how you could use this matrix to compute a 10-year cumulative default probability for the BB-rated bonds.
- What is the (cumulative) probability that a currently BB-rated bond will default within (i) 1 year, and (ii) 2 years? What is the probability that the BB-rated bond will be rated BBB after two years? What is the probability that a BB-rated bond gets downgraded within one year?
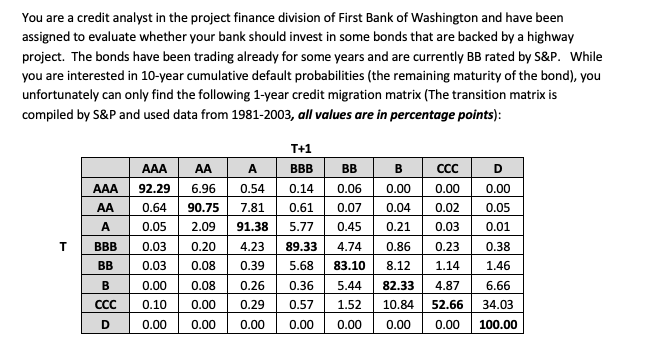
You are a credit analyst in the project finance division of First Bank of Washington and have been assigned to evaluate whether your bank should invest in some bonds that are backed by a highway project. The bonds have been trading already for some years and are currently BB rated by S&P. While you are interested in 10-year cumulative default probabilities (the remaining maturity of the bond), you unfortunately can only find the following 1-year credit migration matrix (The transition matrix is compiled by S&P and used data from 1981-2003, all values are in percentage points): T+1 BBB AAA BB B CCC D 0.00 AAA 6.96 0.54 0.14 0.06 92.29 0.64 0.00 0.04 0.00 0.02 AA 90.75 7.81 0.61 0.07 0.05 A 0.05 2.09 91.38 5.77 0.45 0.21 0.03 0.01 T BBB 0.03 0.20 4.23 89.33 4.74 0.86 0.23 0.38 BB 0.03 0.08 0.39 5.68 83.10 8.12 1.14 1.46 B 0.00 0.08 0.26 0.36 5.44 82.33 4.87 6.66 CCC 0.10 0.00 0.29 0.57 1.52 10.84 52.66 34.03 D 0.00 0.00 0.00 0.00 0.00 0.00 0.00 100.00 You are a credit analyst in the project finance division of First Bank of Washington and have been assigned to evaluate whether your bank should invest in some bonds that are backed by a highway project. The bonds have been trading already for some years and are currently BB rated by S&P. While you are interested in 10-year cumulative default probabilities (the remaining maturity of the bond), you unfortunately can only find the following 1-year credit migration matrix (The transition matrix is compiled by S&P and used data from 1981-2003, all values are in percentage points): T+1 BBB AAA BB B CCC D 0.00 AAA 6.96 0.54 0.14 0.06 92.29 0.64 0.00 0.04 0.00 0.02 AA 90.75 7.81 0.61 0.07 0.05 A 0.05 2.09 91.38 5.77 0.45 0.21 0.03 0.01 T BBB 0.03 0.20 4.23 89.33 4.74 0.86 0.23 0.38 BB 0.03 0.08 0.39 5.68 83.10 8.12 1.14 1.46 B 0.00 0.08 0.26 0.36 5.44 82.33 4.87 6.66 CCC 0.10 0.00 0.29 0.57 1.52 10.84 52.66 34.03 D 0.00 0.00 0.00 0.00 0.00 0.00 0.00 100.00
Step by Step Solution
There are 3 Steps involved in it

Get step-by-step solutions from verified subject matter experts