

Question: Describe patterns within data using measures of central tendency (mean, median, mode,and standard deviation). Describe the utility of measures of central tendency (mean, median, mode,
Describe patterns within data using measures of central tendency (mean, median, mode,and standard deviation).
Describe the utility of measures of central tendency (mean, median, mode, and standard deviation).
Describe the excel functions to calculate of measures of central tendency (mean, median,and mode).
Describe how one can detect patterns of data using measures of central tendency.
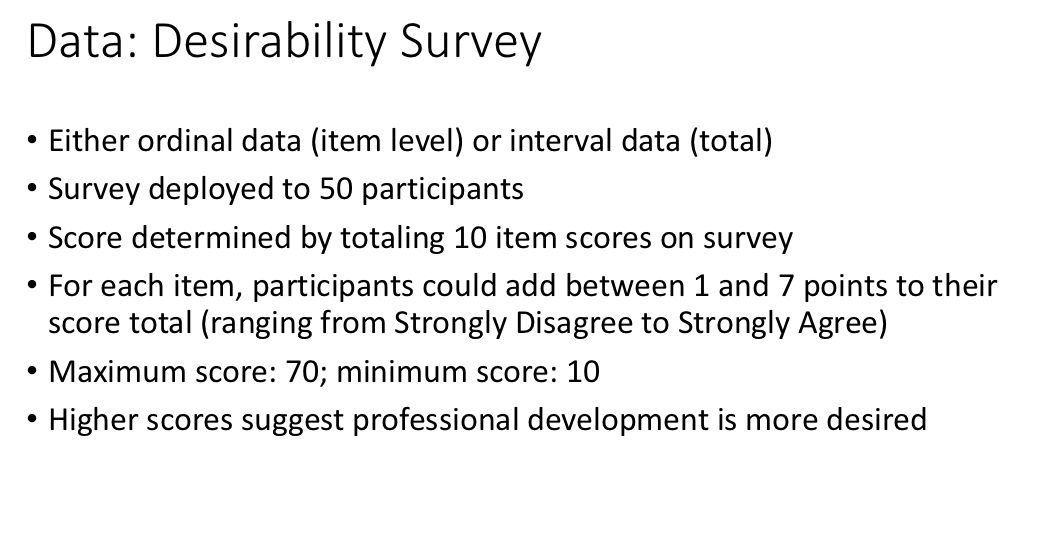
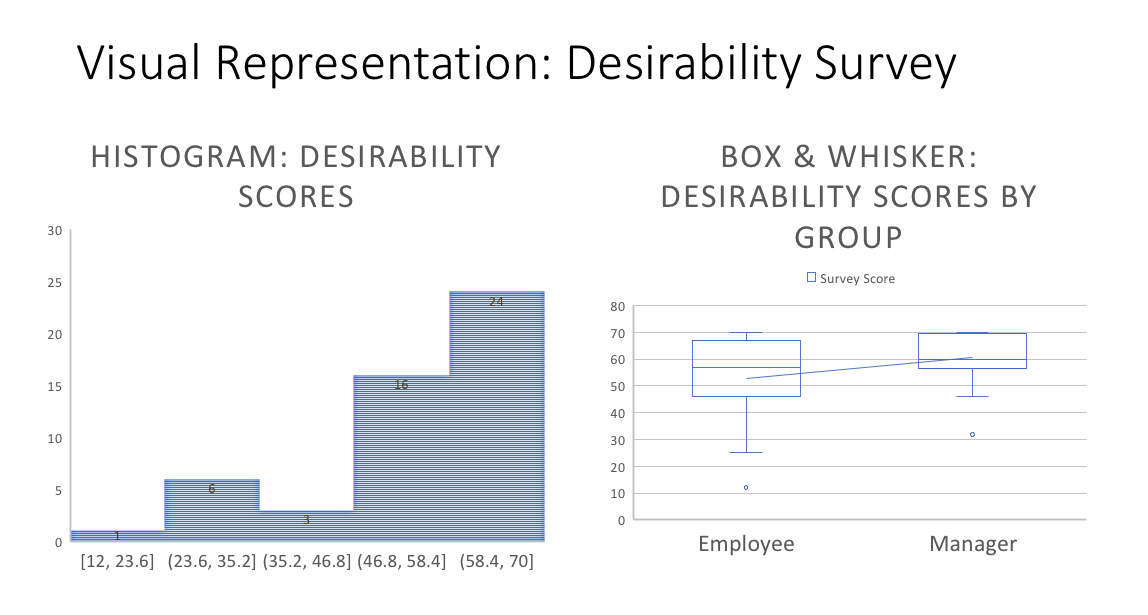
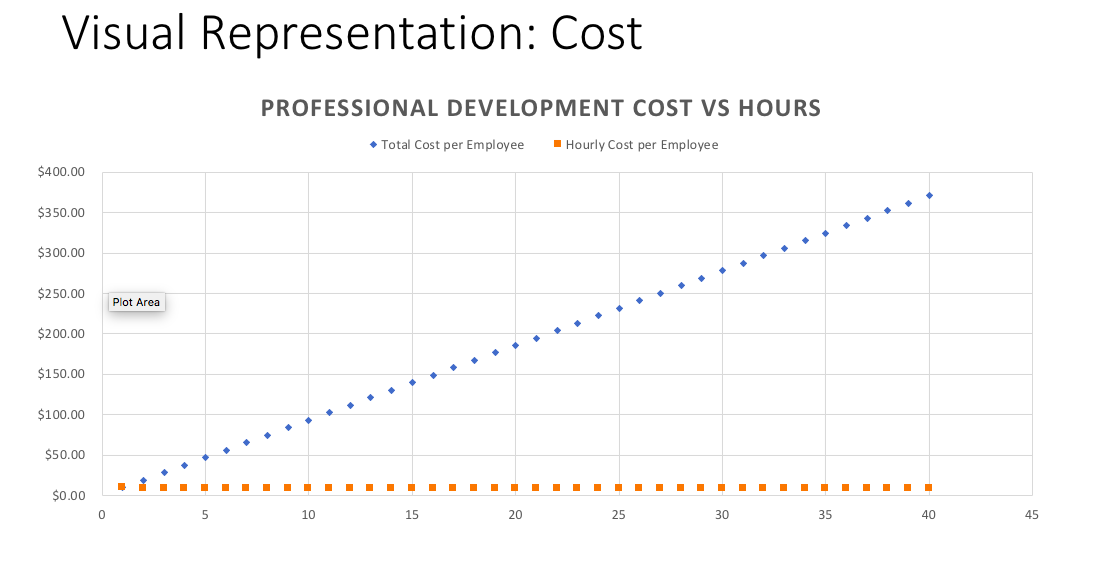
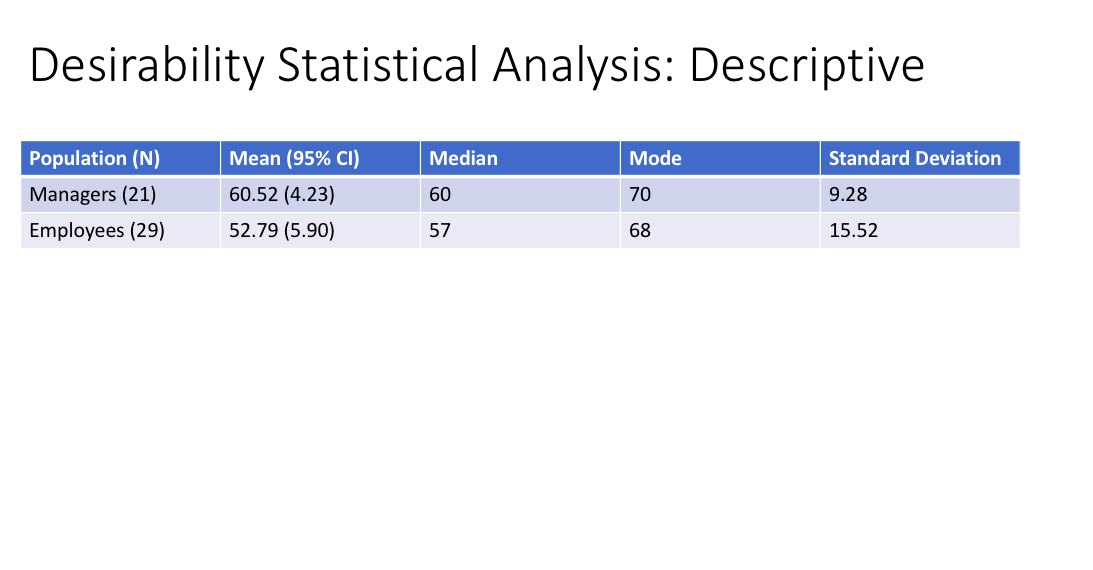
Data: Desirability Survey - Either ordinal data (item level) or interval data (total) - Survey deployed to 50 participants - Score determined by totaling 10 item scores on survey - For each item, participants could add between 1 and 7 points to their score total (ranging from Strongly Disagree to Strongly Agree) - Maximum score: 70; minimum score: 10 - Higher scores suggest professional development is more desired Visual Representation: Desirability Survey HISTOGRAM: DESIRABILITY BOX & WHISKER: SCORES DESIRABILITY SCORES BY 30 GROUP O Survey Score 25 80 70 20 60 50 15 40 30 10 20 5 10 0 Employee Manager 0 [12, 23.6] (23.6, 35.2] (35.2, 46.8] (46.8, 58.4] (58.4, 70]Visual Representation: Cost PROFESSIONAL DEVELOPMENT COST VS HOURS * Total Cost per Employee "Hourly Cost per Employee $400.00 $350.00 $300.00 $250.00 Plot Area $200.00 $150.00 $100.00 $50.00 $0.00 0 5 10 15 20 25 30 35 40 45Visual Representation: Delivery Preference DELIVERY MODE DELIVERY PREFERENCE Hybrid In Person . Online Synchronous Asynchronous 36% 40% 10 20 6 DELIVERY METHOD Synchronous . Asynchronous 8 6 32% HYBRID IN PERSON ONLINE 68%Desirability Statistical Analysis: Descriptive Population (N) Mean {95% Cl} mm Standard Deviation Managers (21) 60. 52 (4. 23) 9.28 Employees (29) 52. 79 (5. 90] 57 68 15.52
Step by Step Solution
There are 3 Steps involved in it

Get step-by-step solutions from verified subject matter experts