

Question: Describe the below graph result Turbidity graph Al(SO4)3 FeCl3 Untreated water 22.4 22.4 2 mg/L 16.7 16.75 5 mg/L 17.45 18.95 8 mg/L 1.59 18.5
Describe the below graph result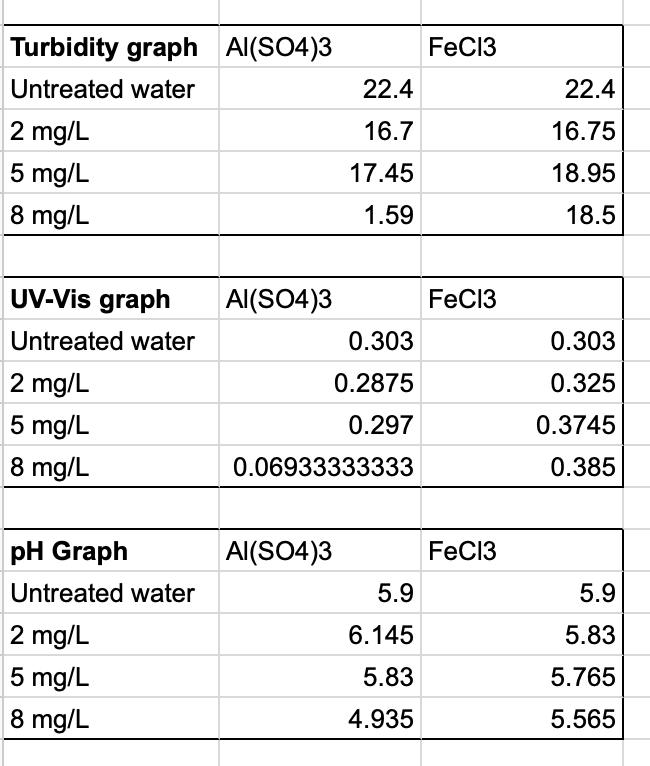
Turbidity graph Al(SO4)3 FeCl3 Untreated water 22.4 22.4 2 mg/L 16.7 16.75 5 mg/L 17.45 18.95 8 mg/L 1.59 18.5 UV-Vis graph Al(SO4)3 FeCl3 Untreated water 0.303 0.303 2 mg/L 0.2875 0.325 5 mg/L 0.297 0.3745 8 mg/L 0.06933333333 0.385 pH Graph Al(SO4)3 FeCl3 Untreated water 5.9 5.9 2 mg/L 6.145 5.83 5 mg/L 5.83 5.765 8 mg/L 4.935 5.565
Step by Step Solution
There are 3 Steps involved in it
1 Expert Approved Answer
Step: 1 Unlock

Question Has Been Solved by an Expert!
Get step-by-step solutions from verified subject matter experts
Step: 2 Unlock
Step: 3 Unlock