

Question: Describe the data collection used in the below statistical data. For example, was it observational study, dates, examination interval, population, number, survey instrument, blood and
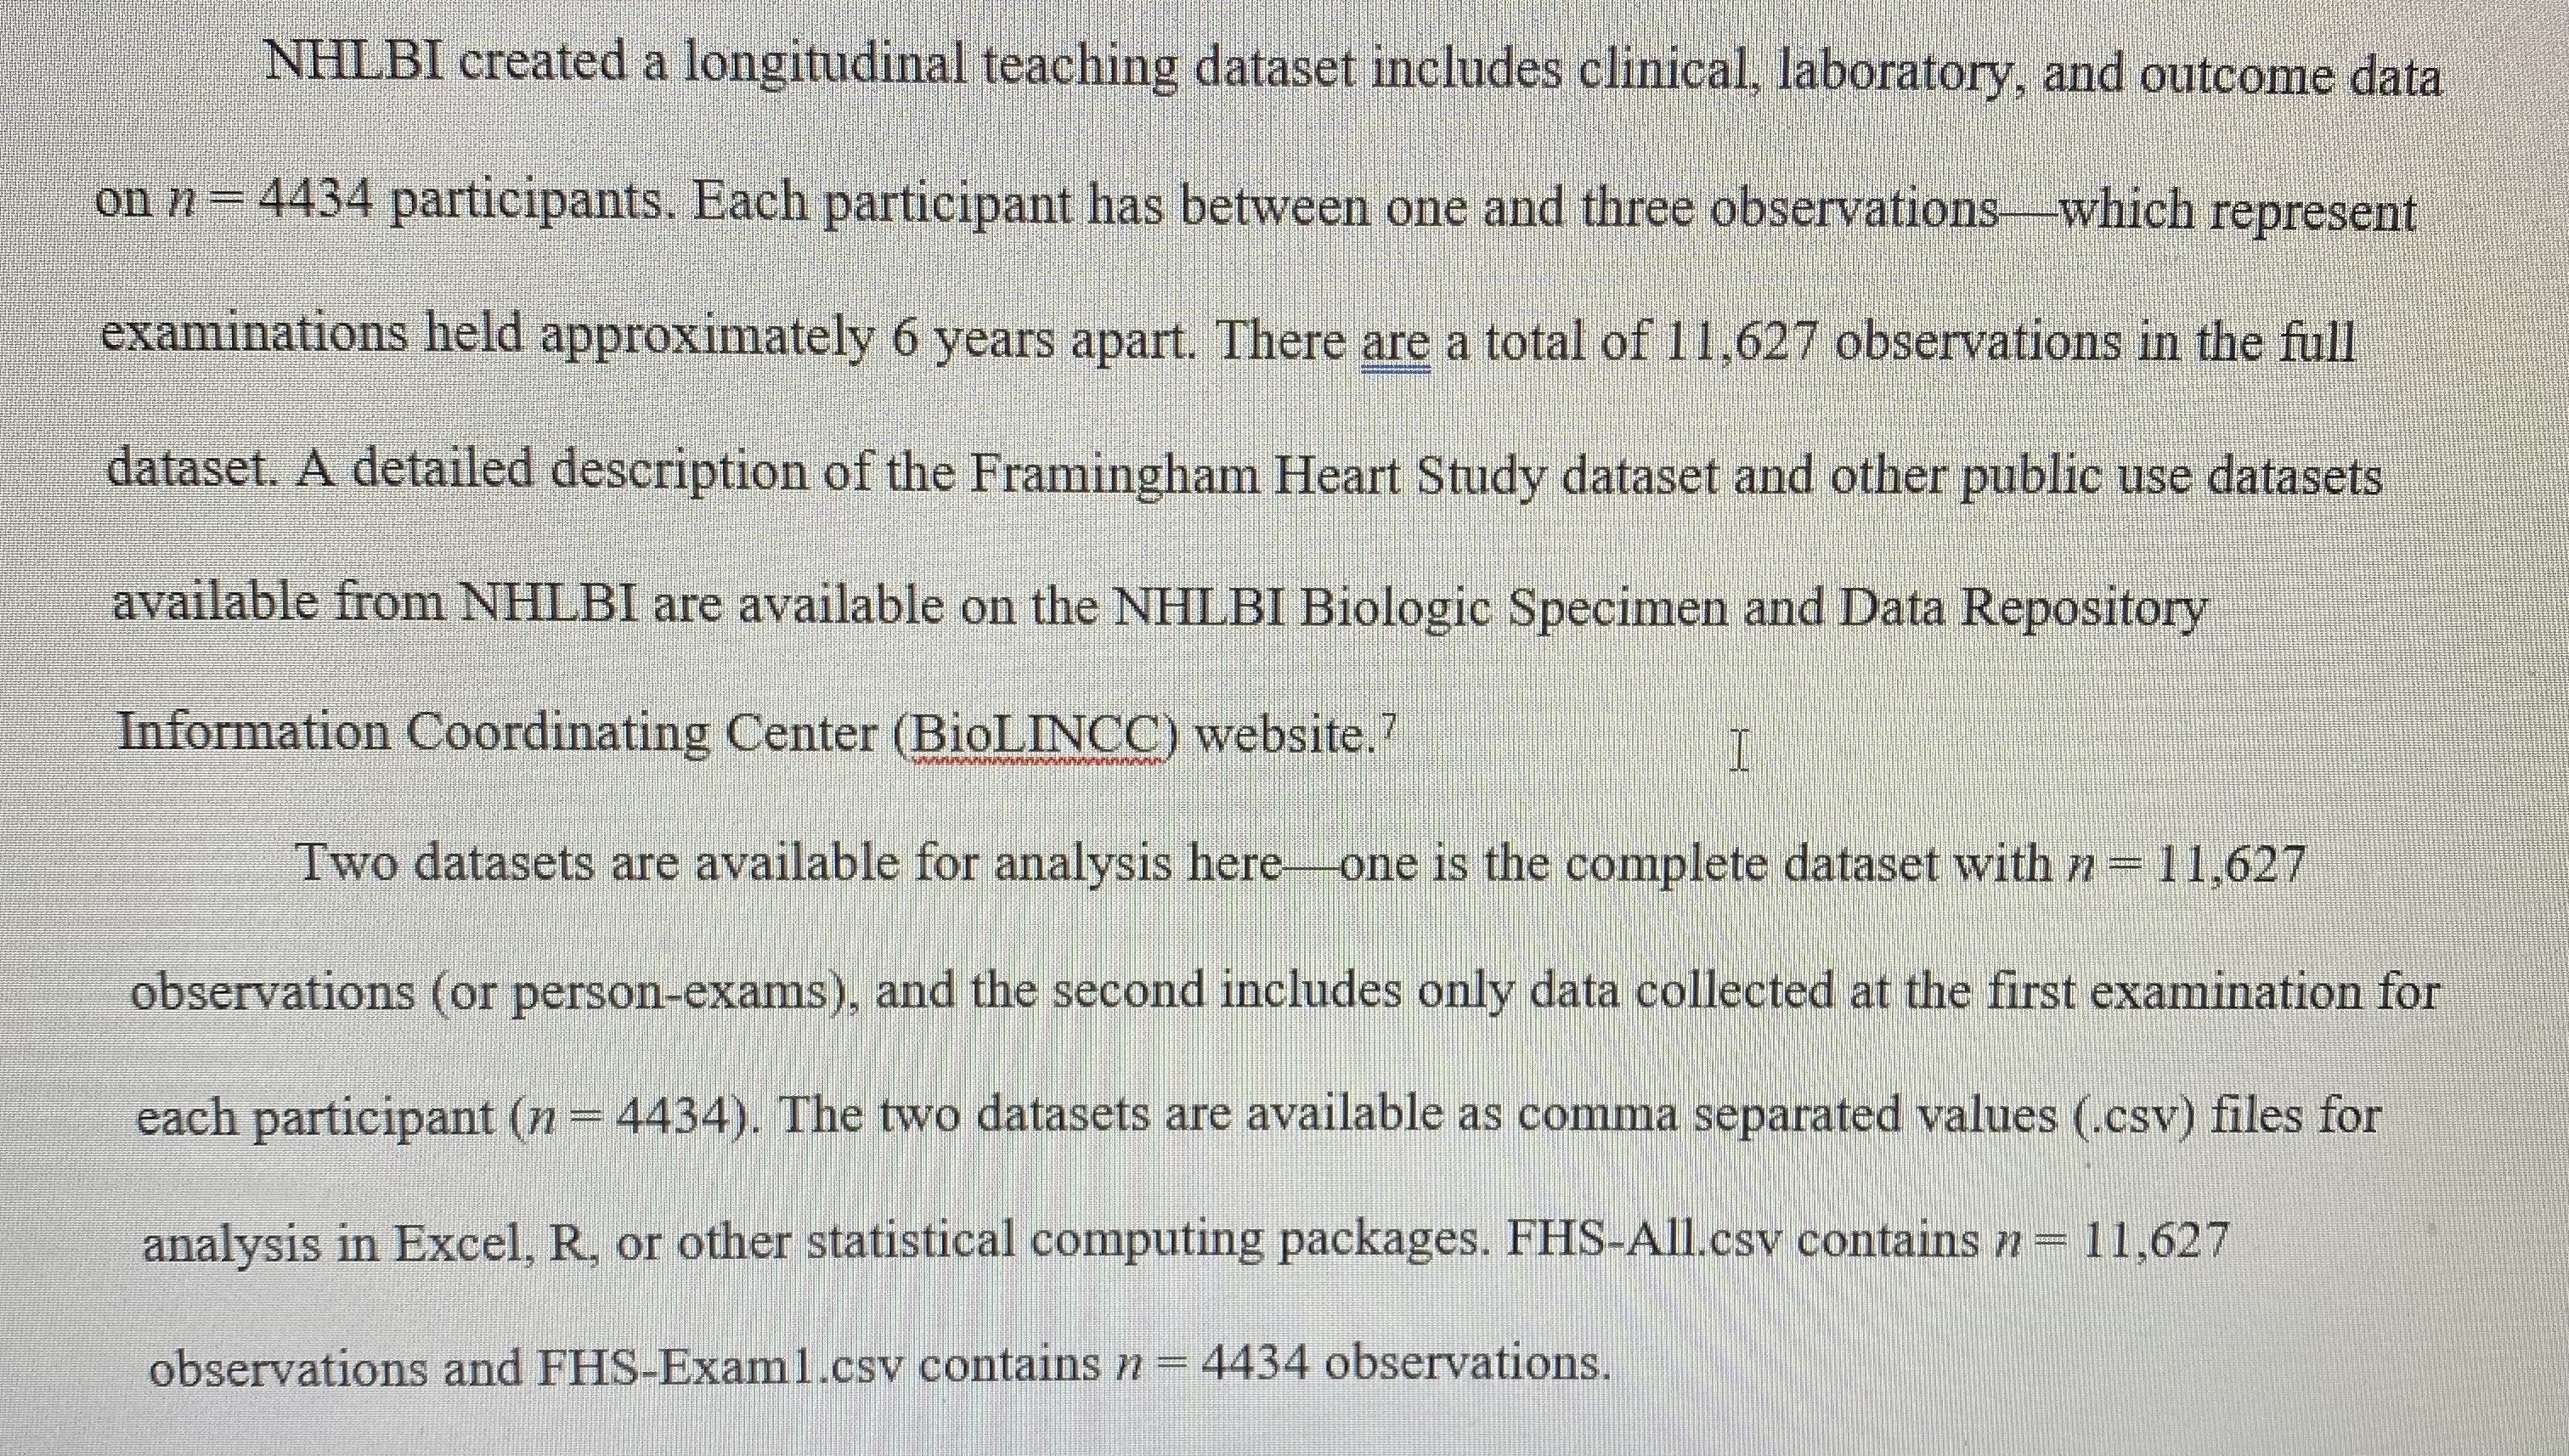
Describe the data collection used in the below statistical data. For example, was it observational study, dates, examination interval, population, number, survey instrument, blood and urine testing and medical tests?
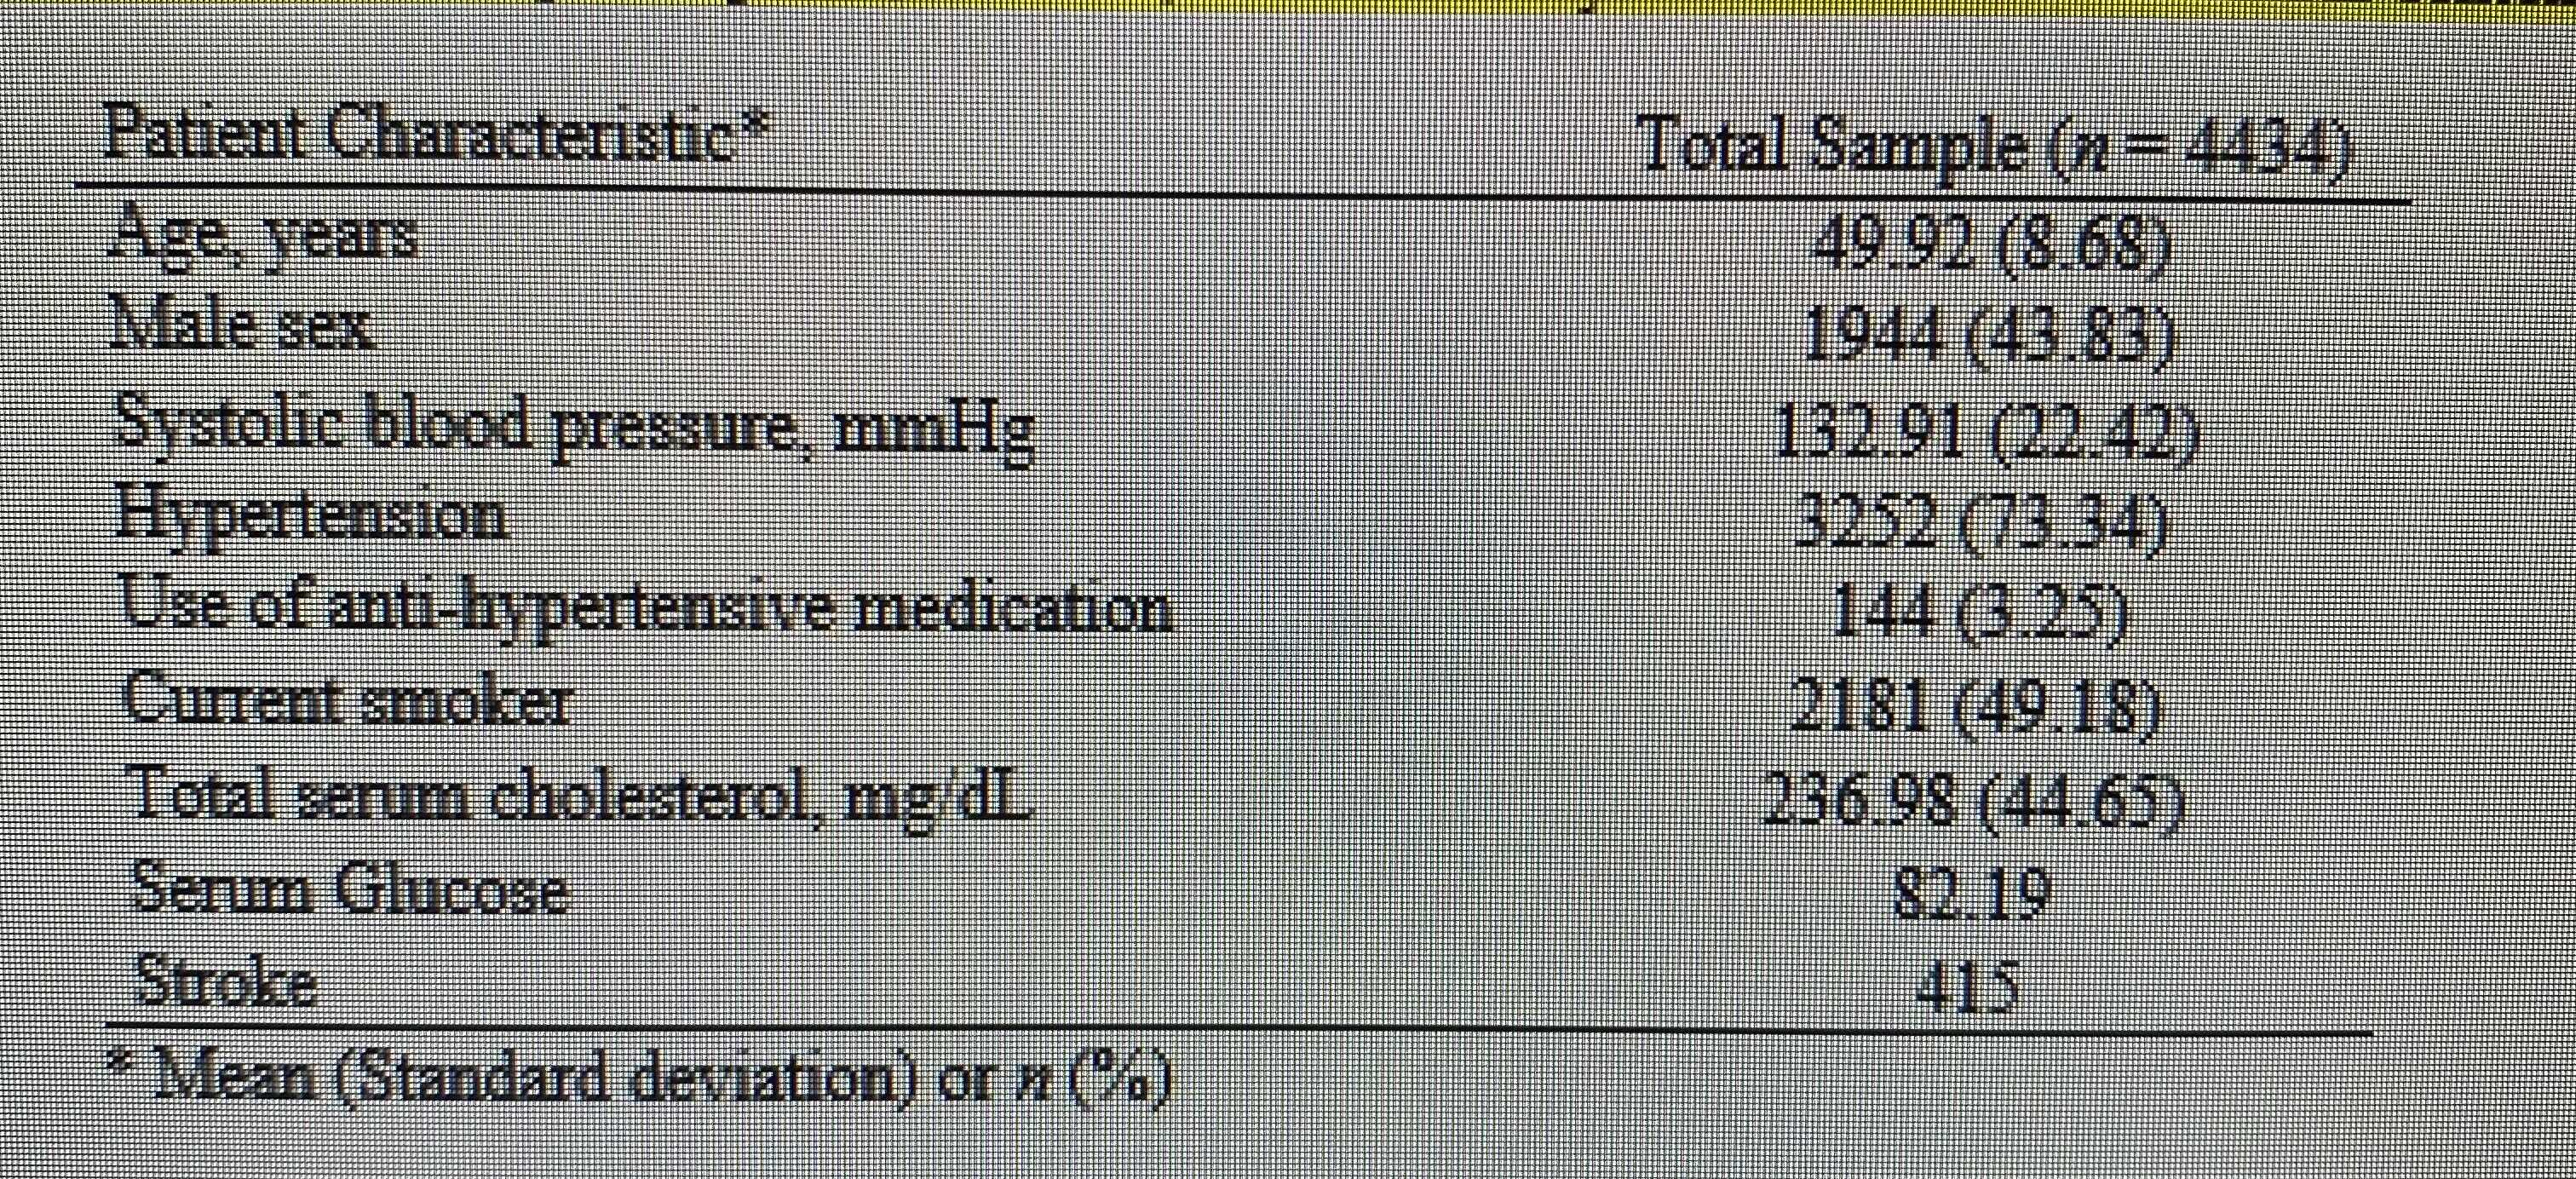
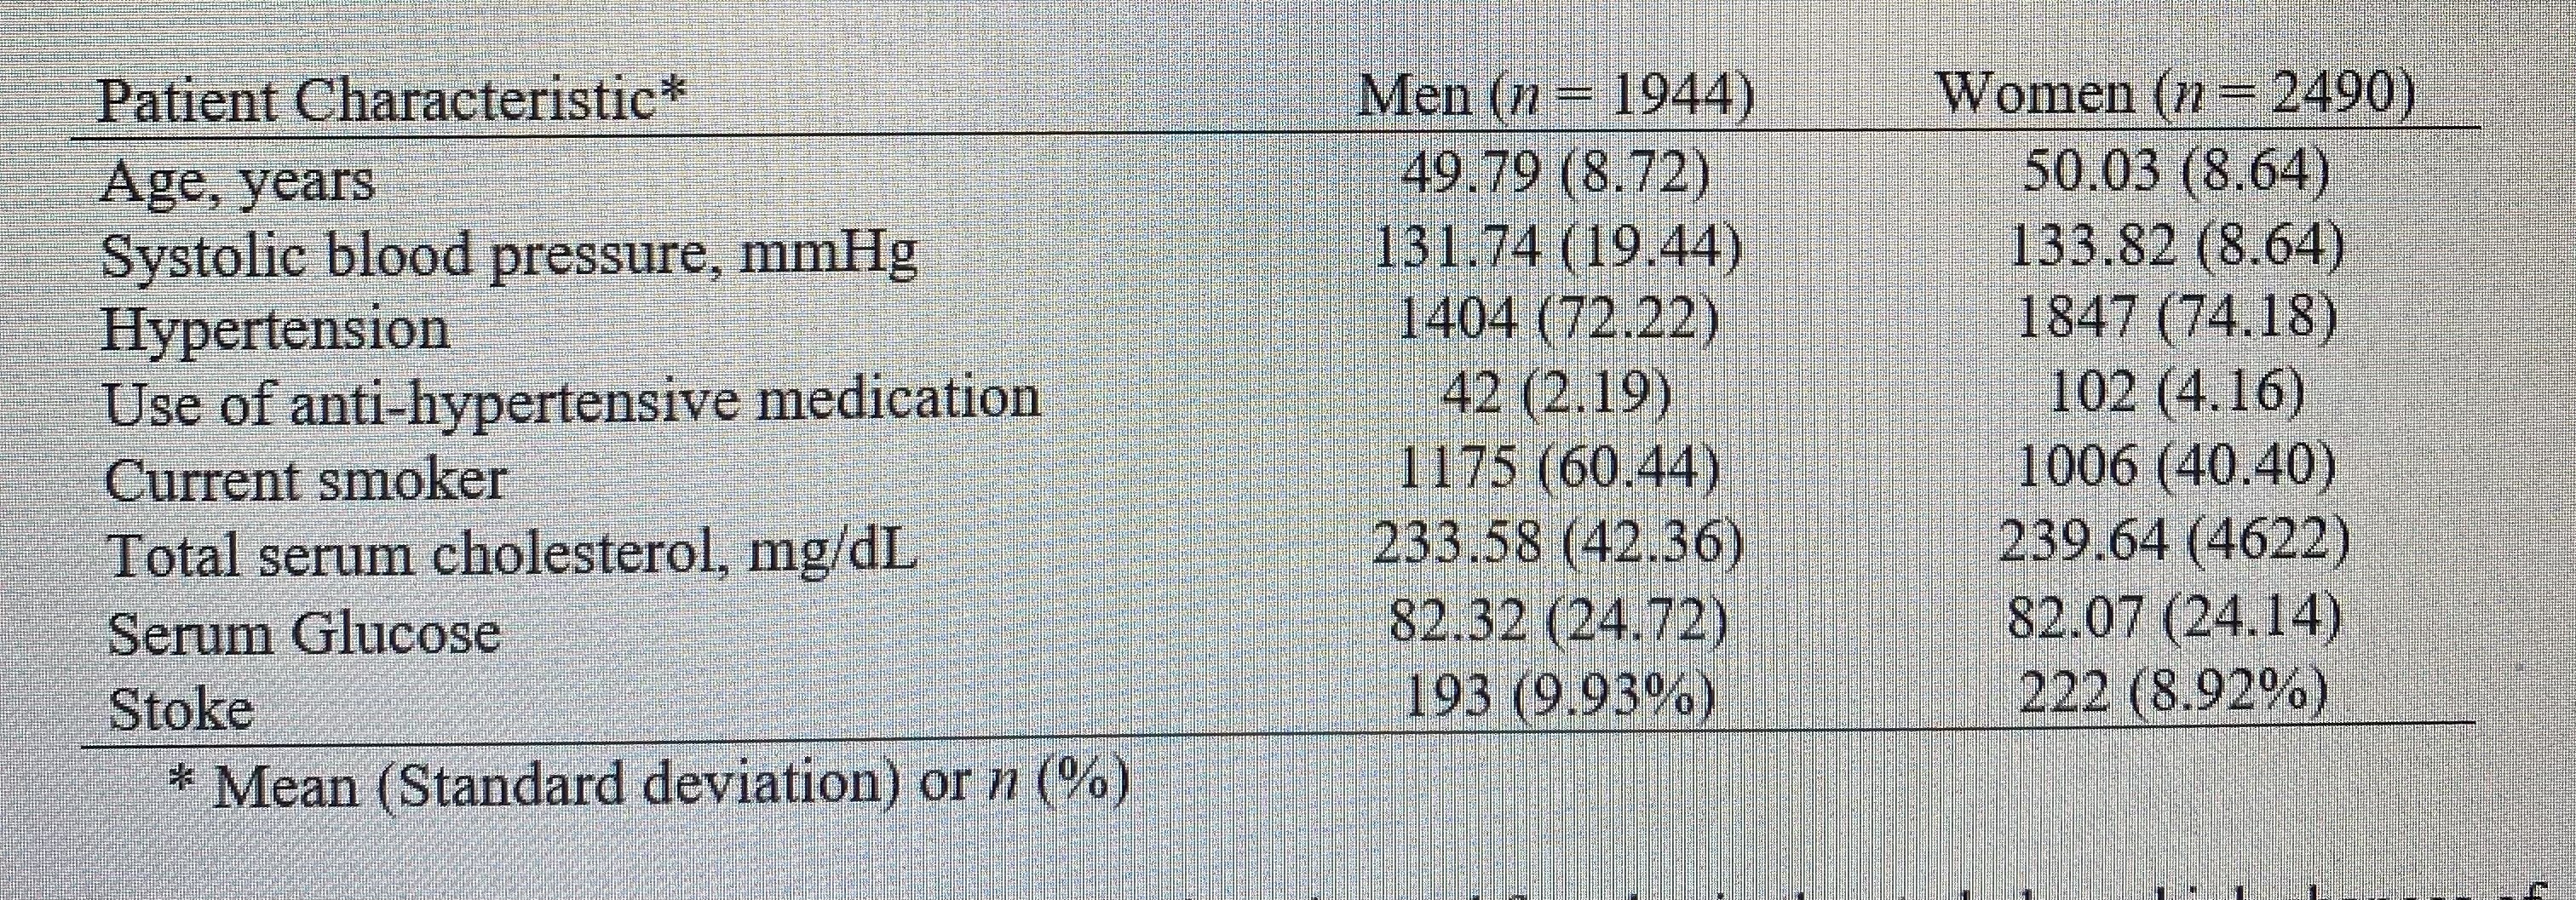
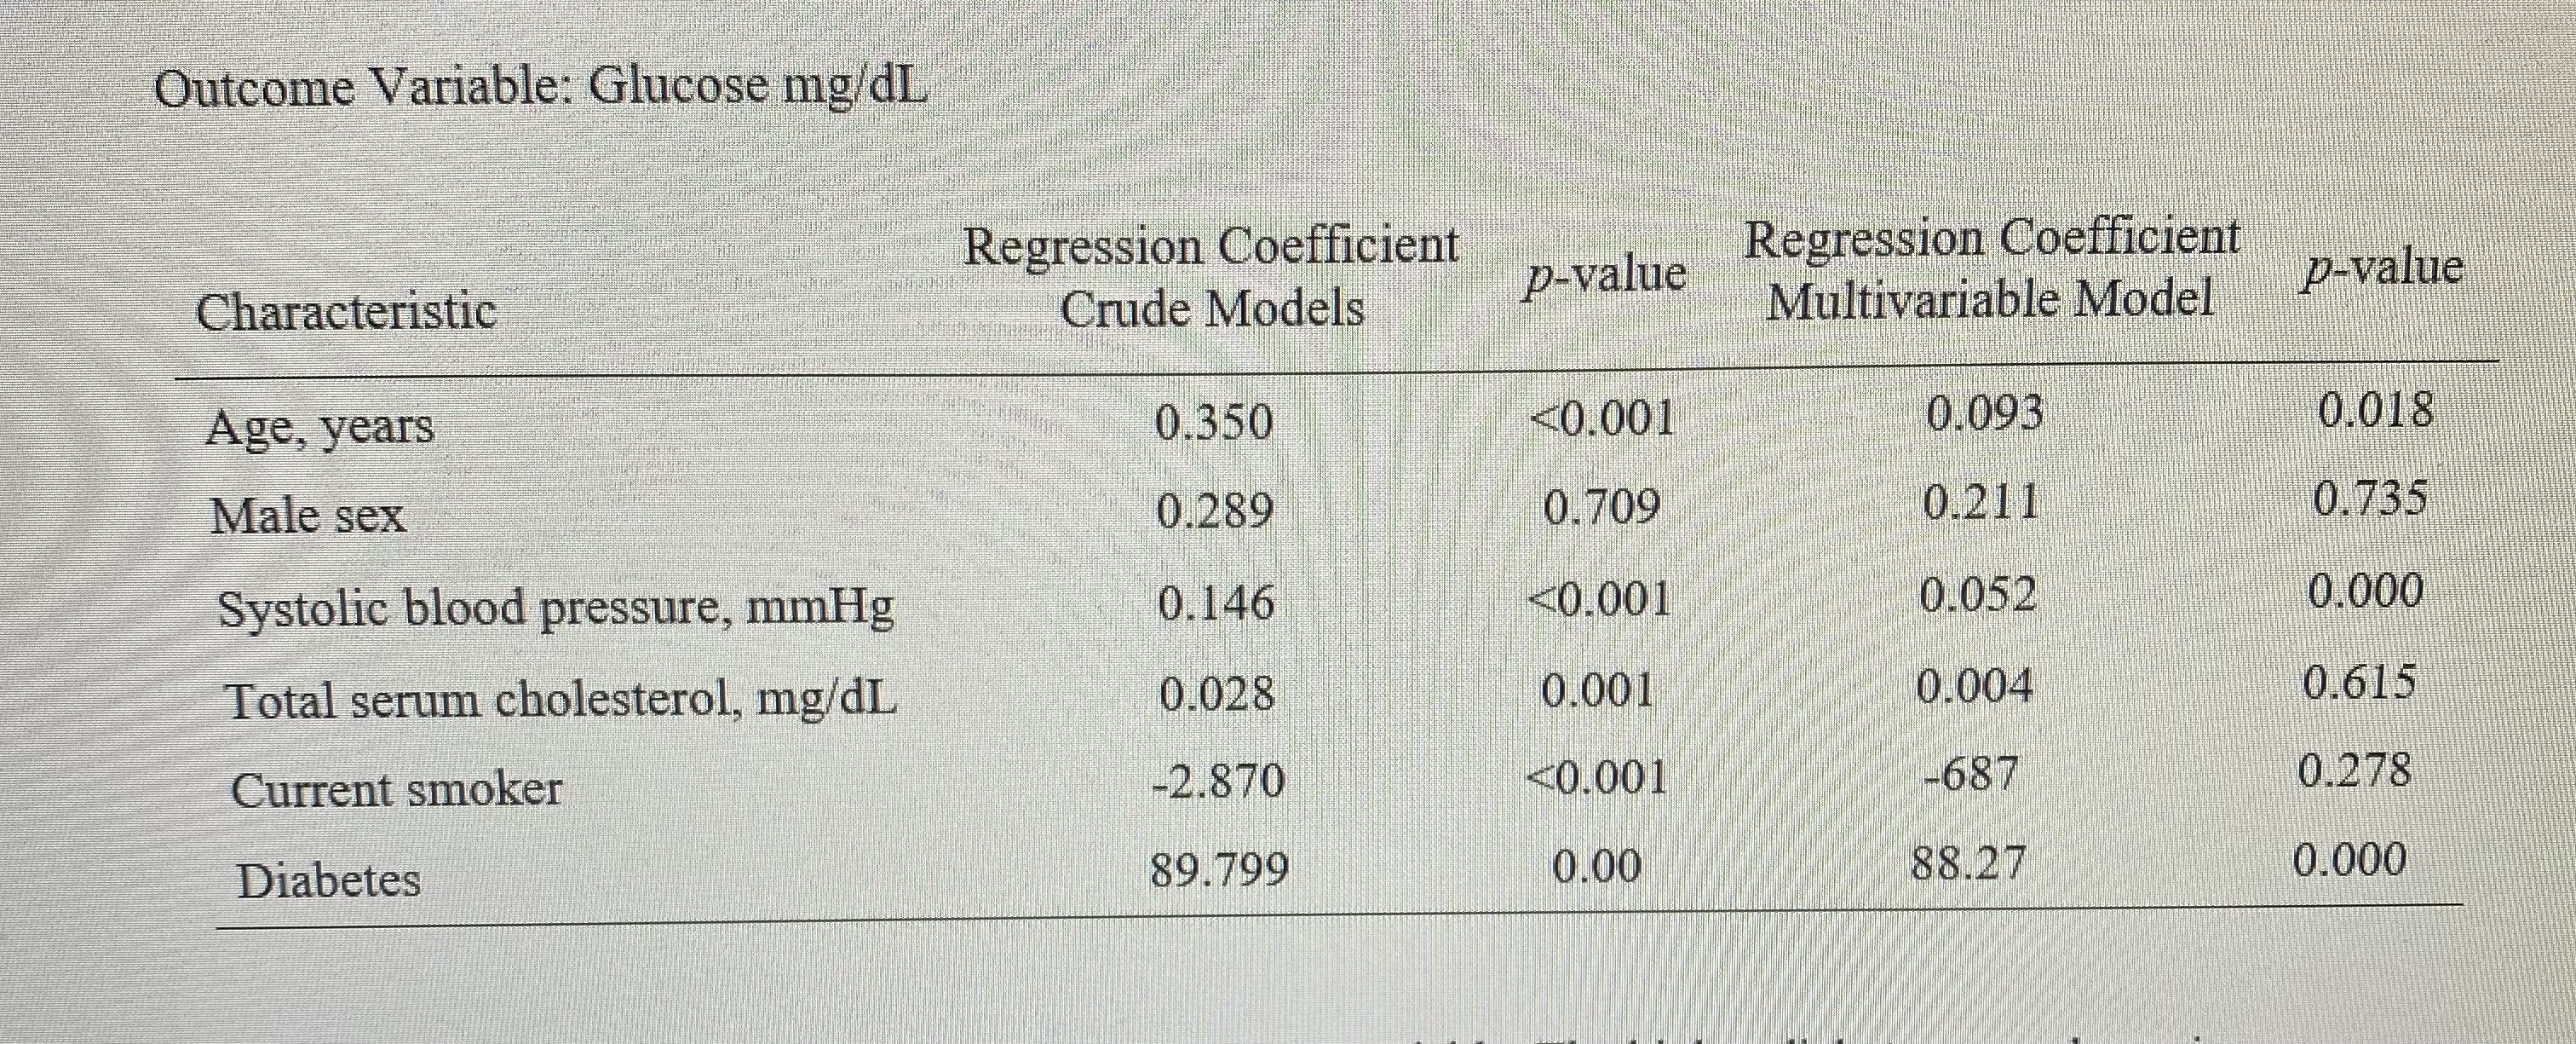
Patient Characteristic Total Sample (n = 4434) Age, years 49 92 (8.68) Male sex 1944 (43.83) Systolic blood pressure, mmHg 132.91 (22.42) Hypertension 3252 (73.34) Use of anti-hypertensive medication 144 (3 25) Current smoker 2181 (49.18) Total serum cholesterol, mg dL 236.98 (44.65) Serum Glucose 82.19 Stroke 415 * Mean (Standard deviation) or / (6)Patient Characteristic* Men (n = 1944) Women (7 = 2490) Age, years 49.79 (8.72) 50.03 (8.64) Systolic blood pressure, mmHg 131.74 (19.44) 133.82 (8.64) Hypertension 1404 (72.22) 1847 (74.18) Use of anti-hypertensive medication 42 (2.19) 102 (4.16) Current smoker 1175 (60.44) 1006 (40.40) Total serum cholesterol, mg/dL 233.58 (42.36) 239.64 (4622) Serum Glucose 82.32 (24.72) 82.07 (24.14) Stoke 193 (9.93%) 222 (8.92%) * Mean (Standard deviation) or / (%)Outcome Variable: Glucose mg/dL Regression Coefficient Regression Coefficient Characteristic Crude Models p-value Multivariable Model p-value Age, years 0.350
Step by Step Solution
There are 3 Steps involved in it

Get step-by-step solutions from verified subject matter experts