

Question: Describe the differences in yields between the two graphs. In what periods does inflation seem to be the highest? The lowest? Explanation should be as
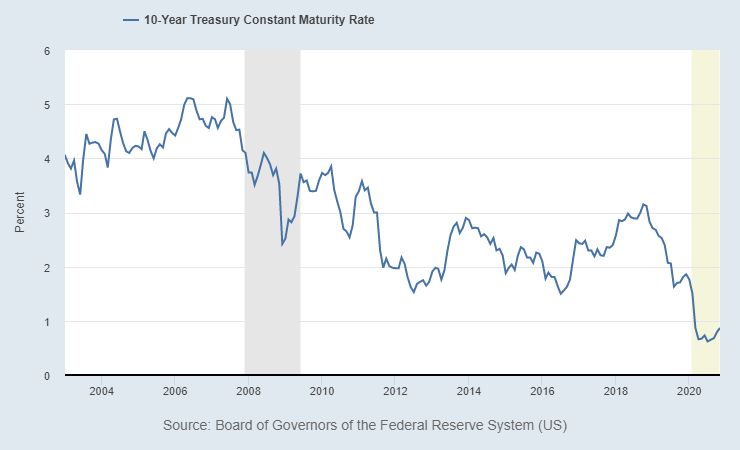
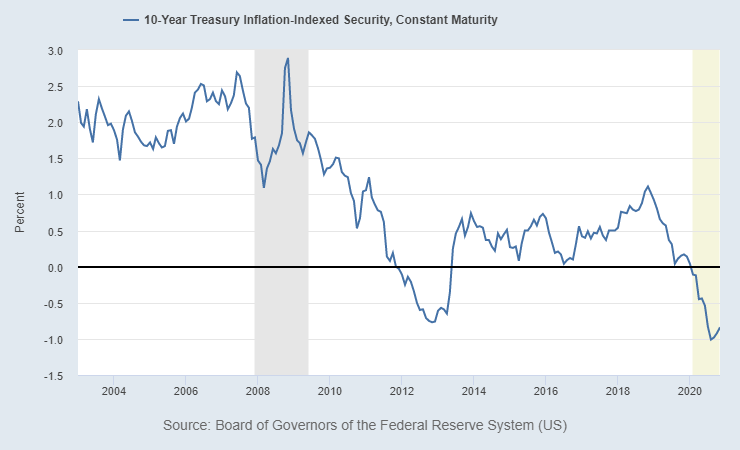
- Describe the differences in yields between the two graphs. In what periods does inflation seem to be the highest? The lowest? Explanation should be as thorough as possible and should be at least 1 paragraph.
10-Year Treasury Constant Maturity Rate 6 5 4 yhan Percent mu 3 2 1 2004 2006 2008 2010 2012 2014 2016 2018 2020 Source: Board of Governors of the Federal Reserve System (US) 10-Year Treasury Inflation Indexed Security, Constant Maturity 3.0 2.5 2.0 un 1.5 1.0 Percent 0.5 Mummm 0.0 -0.5 -1.0 -1.5 2004 2006 2008 2010 2012 2014 2016 2018 2020 Source: Board of Governors of the Federal Reserve System (US)
Step by Step Solution
There are 3 Steps involved in it
1 Expert Approved Answer
Step: 1 Unlock

Question Has Been Solved by an Expert!
Get step-by-step solutions from verified subject matter experts
Step: 2 Unlock
Step: 3 Unlock