

Question: Describe the graph and interpret the points (A, B and C) Answer ? 1,200 1,000 Total revenue Target profit ($200,000) 800 - Total cost Cost
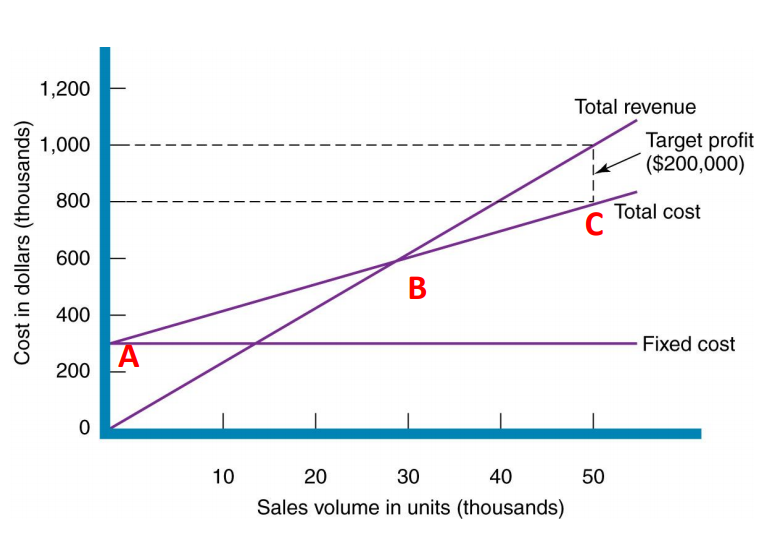
Describe the graph and interpret the points (A, B and C) Answer ?
1,200 1,000 Total revenue Target profit ($200,000) 800 - Total cost Cost in dollars (thousands) 600 B 400 Fixed cost A 200 0 10 50 20 30 40 Sales volume in units (thousands)Step by Step Solution
There are 3 Steps involved in it
1 Expert Approved Answer
Step: 1 Unlock

Question Has Been Solved by an Expert!
Get step-by-step solutions from verified subject matter experts
Step: 2 Unlock
Step: 3 Unlock