

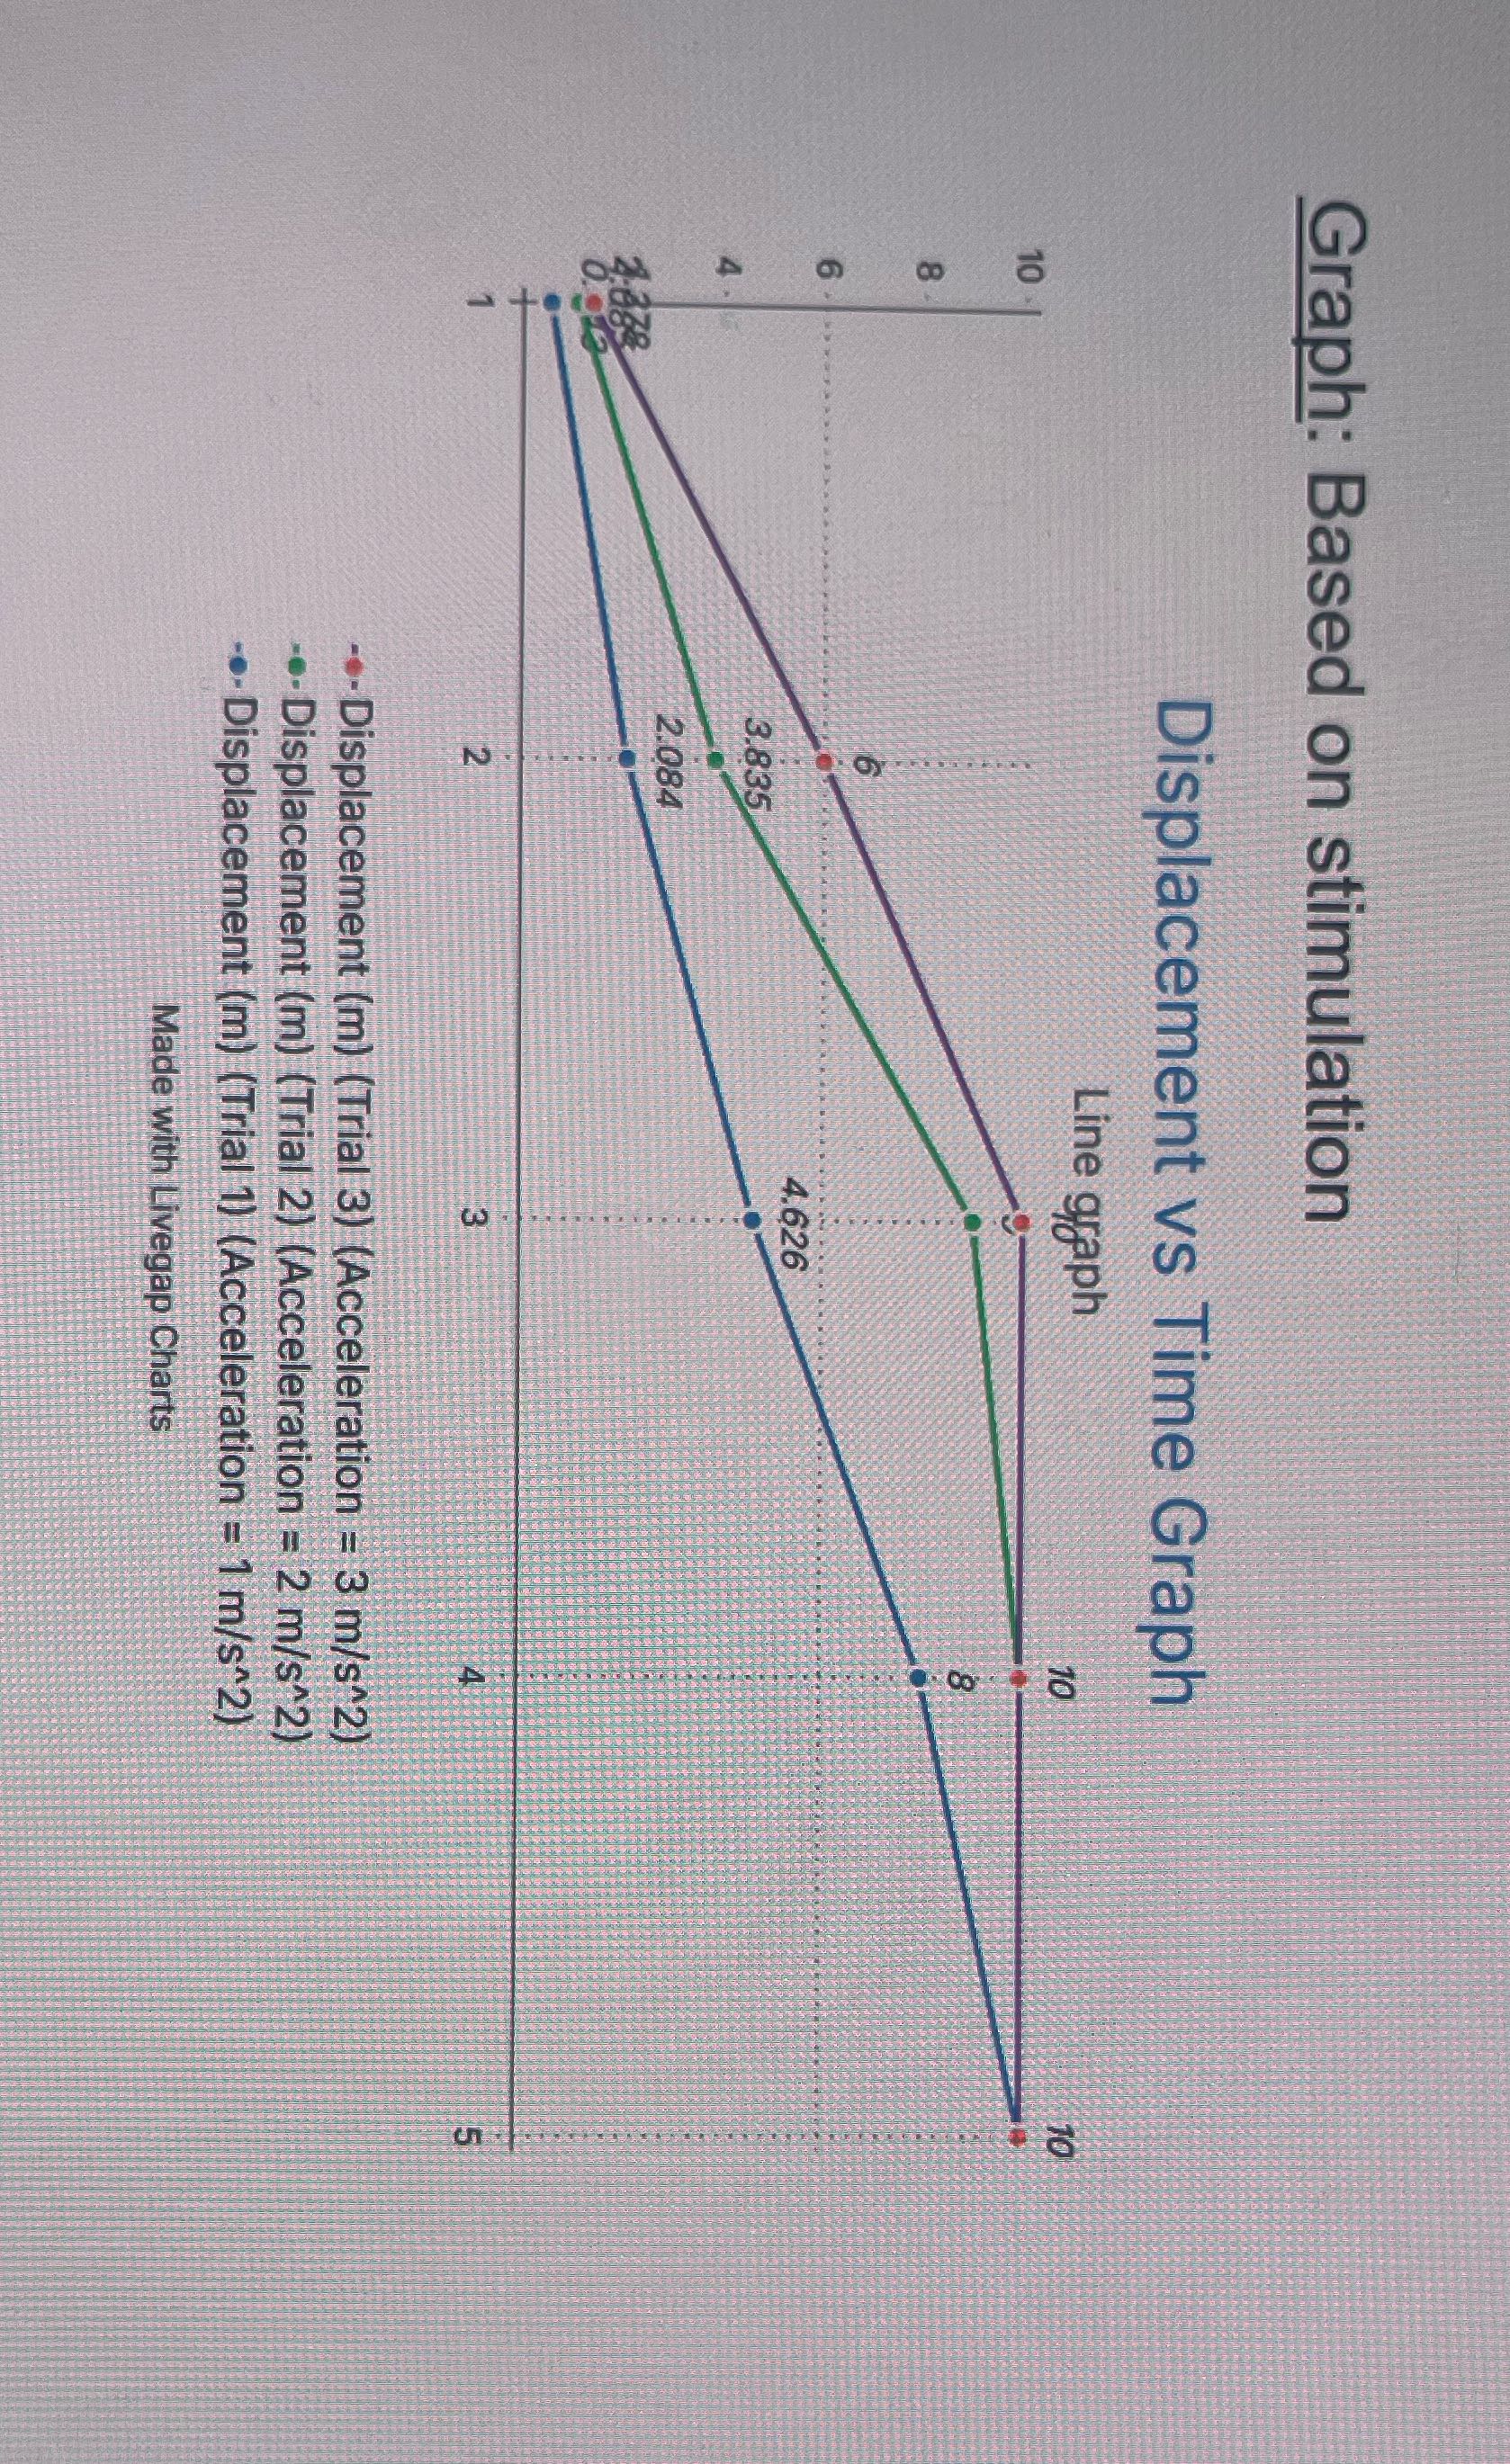
Question: Describe the pattern and trends shown in this graph Graph: Based on stimulation Displacement vs Time Graph Line graph 4.626 3.835 2.084 IVO -.- Displacement
Describe the pattern and trends shown in this graph
Step by Step Solution
There are 3 Steps involved in it
1 Expert Approved Answer
Step: 1 Unlock

Question Has Been Solved by an Expert!
Get step-by-step solutions from verified subject matter experts
Step: 2 Unlock
Step: 3 Unlock