

Question: Describe the relationship based on the given scatter * 1 point diagram. O negative relationship O positive relationhip O zero relationship Describe the relationship based
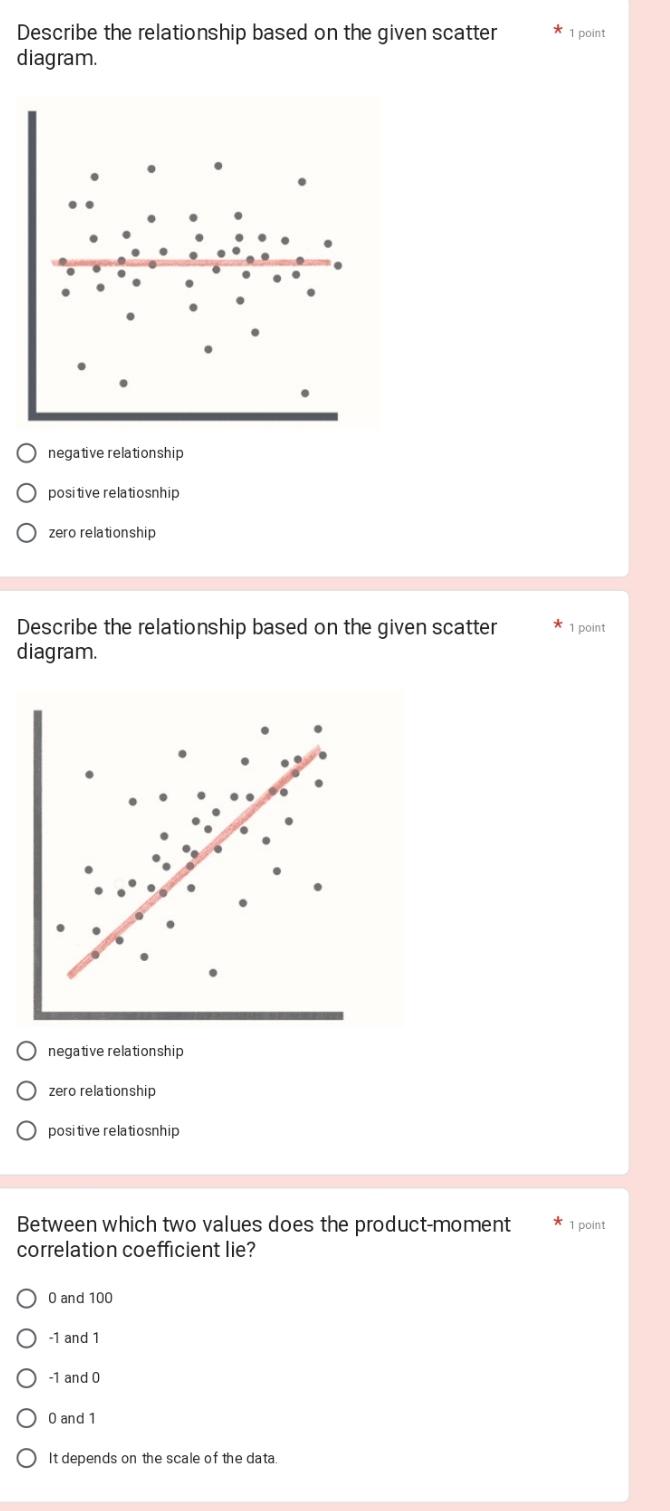
Describe the relationship based on the given scatter * 1 point diagram. O negative relationship O positive relationhip O zero relationship Describe the relationship based on the given scatter * 1 point diagram. O negative relationship O zero relationship O positive relationhip Between which two values does the product-moment * 1 point correlation coefficient lie? O 0 and 100 -1 and 1 -1 and 0 O O and 1 O It depends on the scale of the data
Step by Step Solution
There are 3 Steps involved in it
1 Expert Approved Answer
Step: 1 Unlock

Question Has Been Solved by an Expert!
Get step-by-step solutions from verified subject matter experts
Step: 2 Unlock
Step: 3 Unlock