

Question: Describe the shown map. STRUCTURE CONTOUR MAP which in on top of the Cretaceous Mishrif foirmation. Describe the map & anticline trend width, length
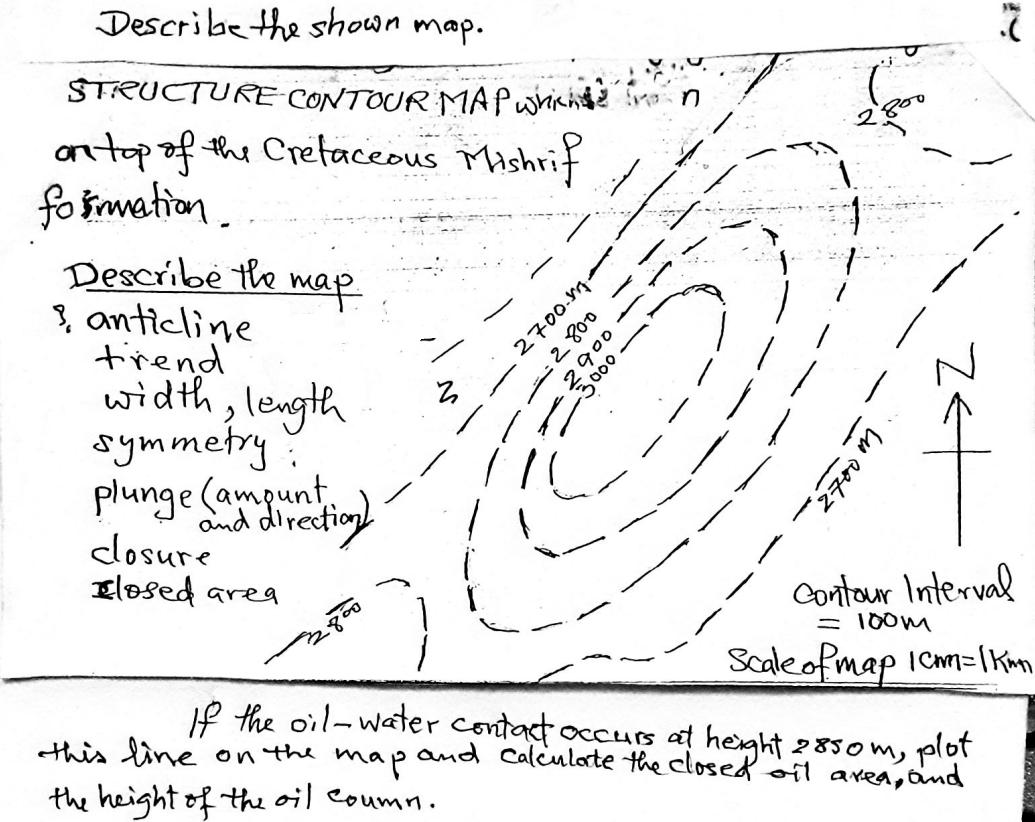
Describe the shown map. STRUCTURE CONTOUR MAP which in on top of the Cretaceous Mishrif foirmation. Describe the map & anticline trend width, length symmetry: plunge (amountation) direction closure Elosed area this line on the the height of the oil coumn. 2700- - 2800 2900 -3000 p Cu ratz zet ( 200 Contour Interval = 100m Scale of map 1cm=1kmn If the oil-water contact occurs at height 2850 m, plot and calculate the closed oil area, and
Step by Step Solution
3.48 Rating (148 Votes )
There are 3 Steps involved in it
Annotated image showing anticline axis and oil water contact The structure is a doubly plunging anti... View full answer

Get step-by-step solutions from verified subject matter experts