

Question: Describe the variable. Randomly choose a sample of 3 0 observations. List them in a table and find the following: a . The sample mean.
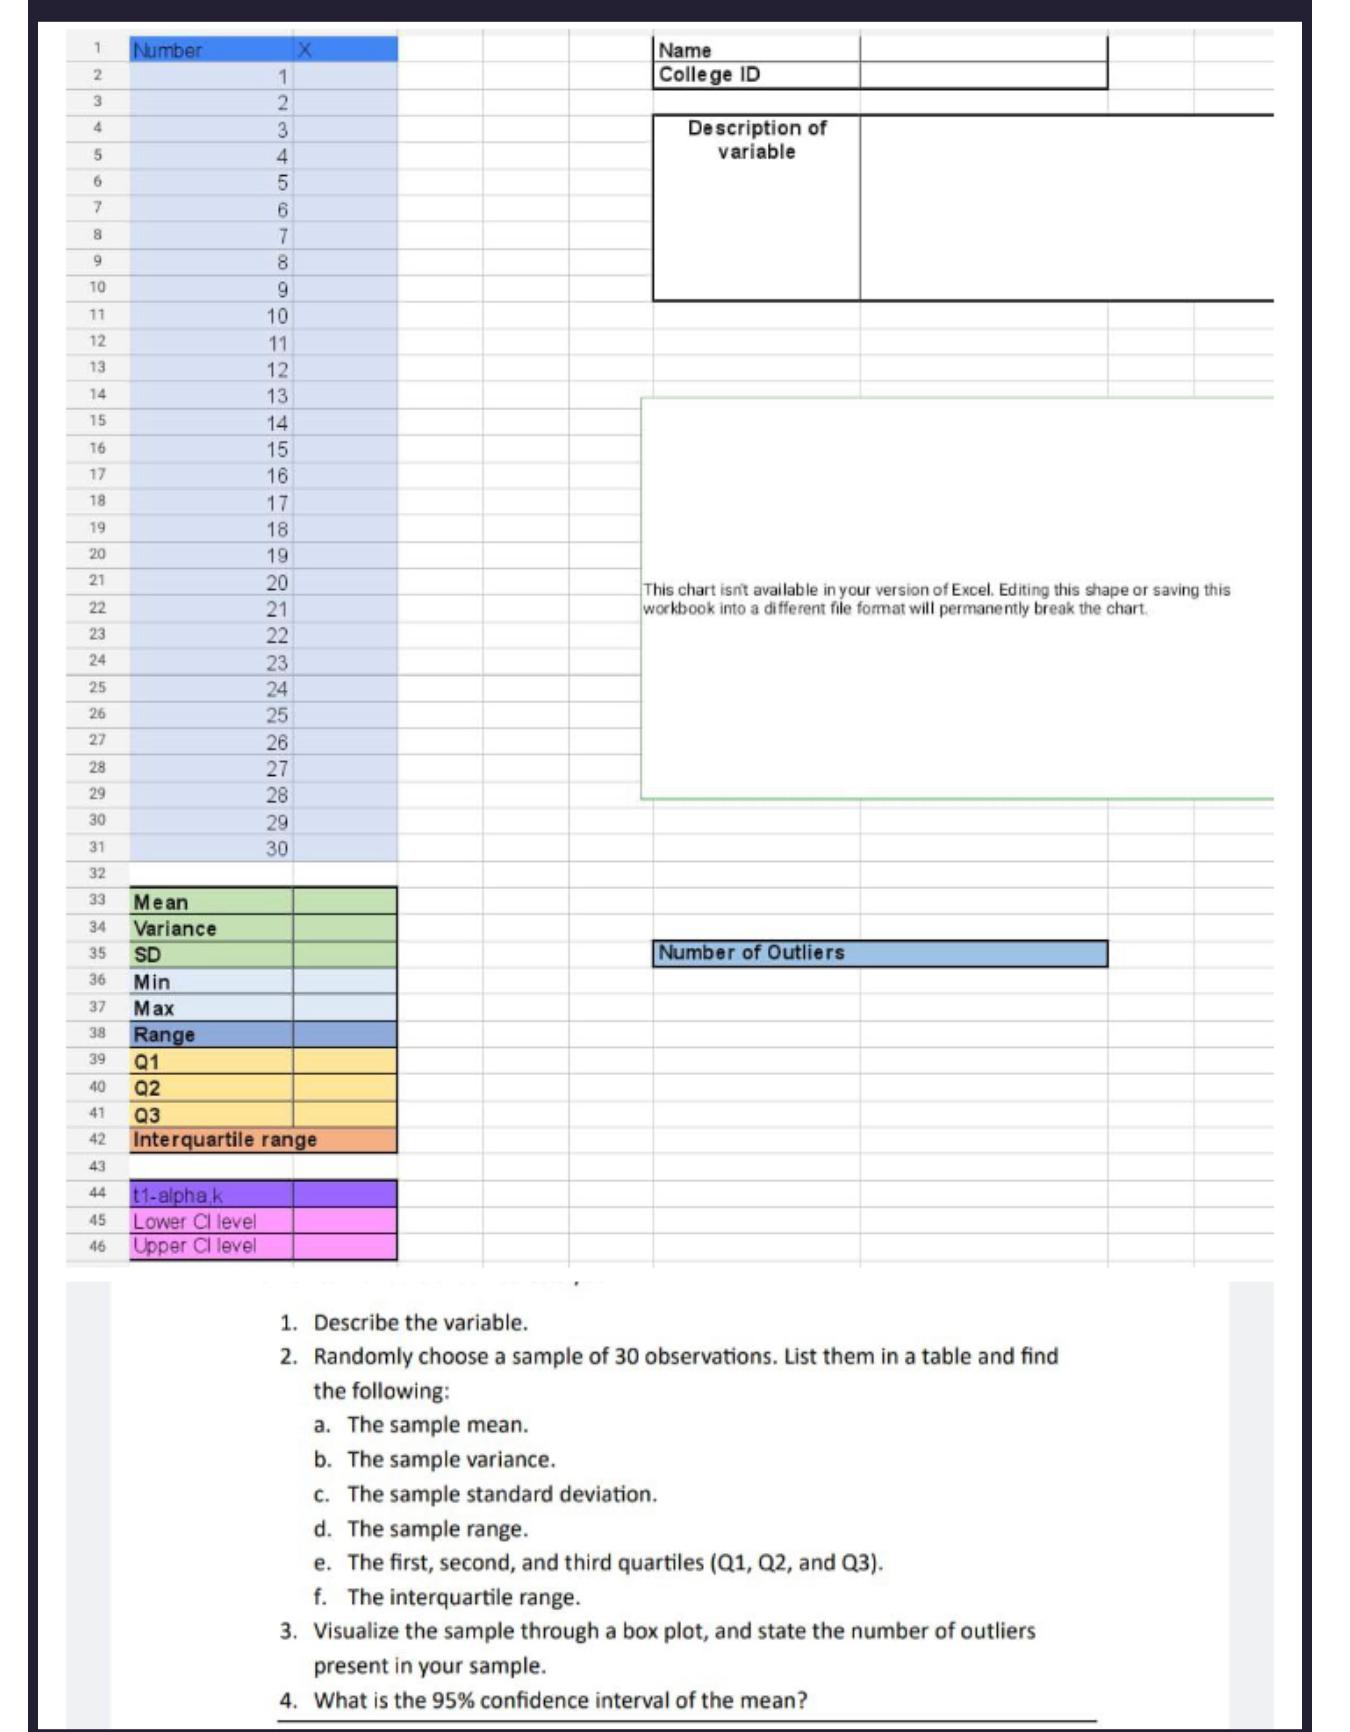
Describe the variable.
Randomly choose a sample of observations. List them in a table and find the following:
a The sample mean.
b The sample variance.
c The sample standard deviation.
d The sample range.
e The first, second, and third quartiles Q Q and Q
f The interquartile range.
Visualize the sample through a box plot, and state the number of outliers present in your sample.
What is the confidence interval of the mean?
Step by Step Solution
There are 3 Steps involved in it
1 Expert Approved Answer
Step: 1 Unlock

Question Has Been Solved by an Expert!
Get step-by-step solutions from verified subject matter experts
Step: 2 Unlock
Step: 3 Unlock