

Question: Describe these histograms. Be precise in your language. What can you say about female literacy rates in poor versus middle-income countries, based on these graphs?
Describe these histograms. Be precise in your language. What can you say about female literacy rates in poor versus middle-income countries, based on these graphs?
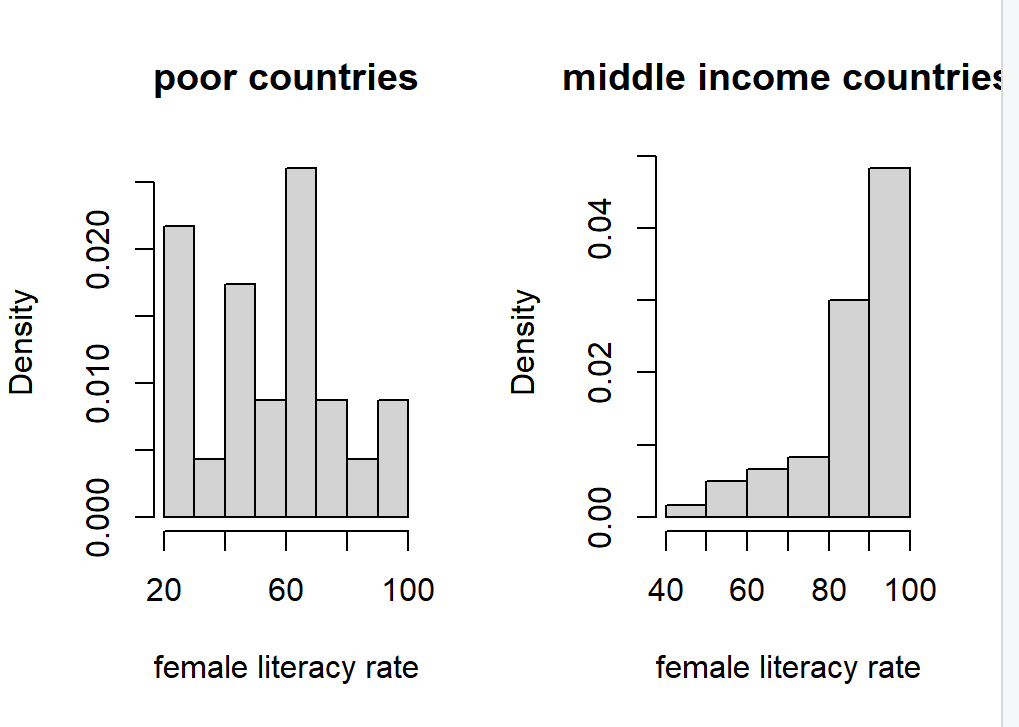
Density 0.010 0.020 0.000 poor countries llIlI 20 60 100 female literacy rate Density middle income countries. 0.04 0.02 0.00 40 60 80 100 female literacy rate
Step by Step Solution
There are 3 Steps involved in it
1 Expert Approved Answer
Step: 1 Unlock

Question Has Been Solved by an Expert!
Get step-by-step solutions from verified subject matter experts
Step: 2 Unlock
Step: 3 Unlock