

Question: describe what you learned from each LOS graph and provide a concise analysis for each graph, between 1-2 sentences or a single paragraph. Make sure

describe what you learned from each LOS graph and provide a concise analysis for each graph, between 1-2 sentences or a single paragraph. Make sure to support the conclusions of your research with an explanation.
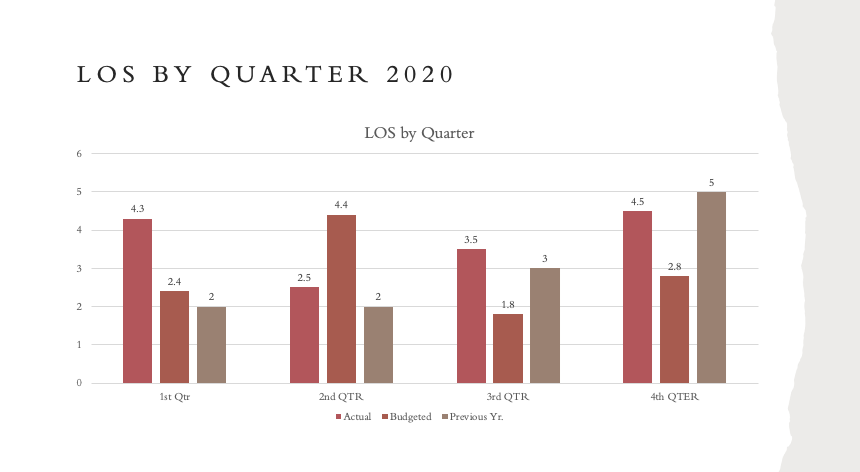
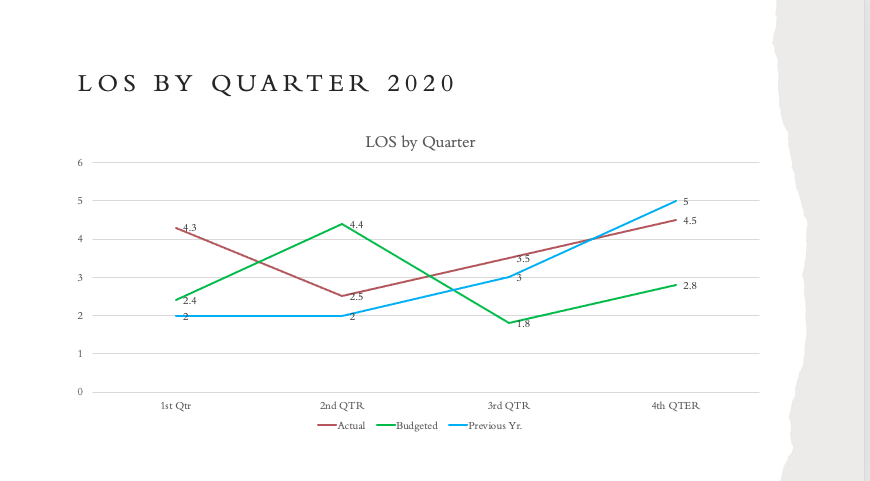
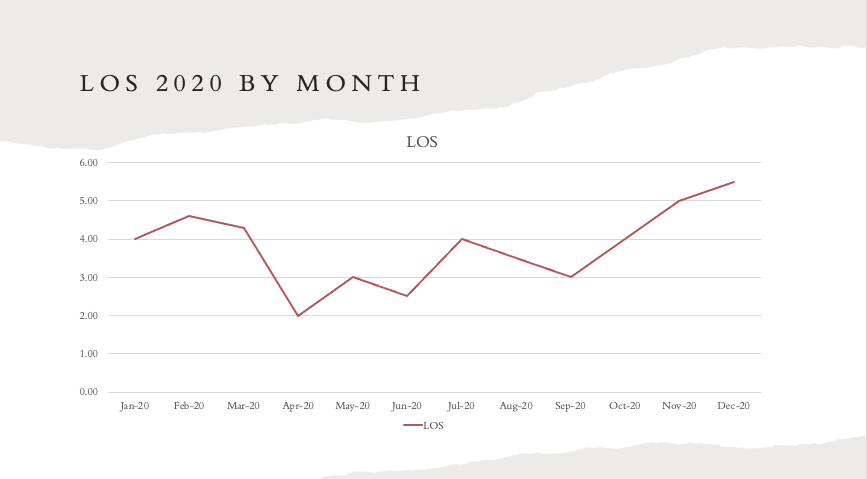
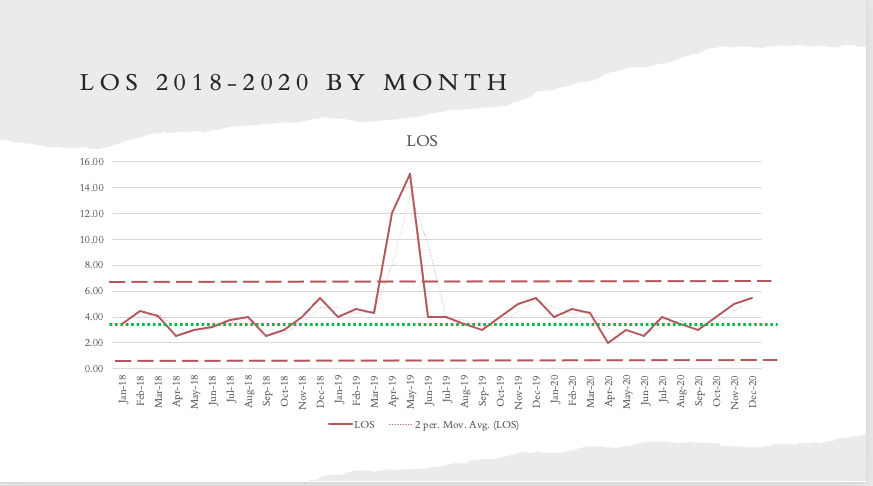
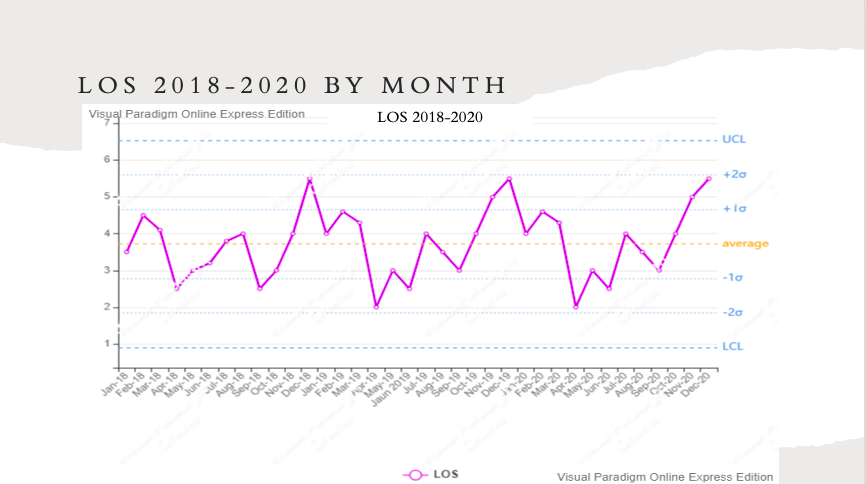
HCA 607 WHAT IS THE DATA TELLING YOU? LOS BY QUARTER 2020 LOS by Quarter 6 5 5 4.3 4.4 4.5 4 3.5 3 3 2.8 2.4 2.5 2 2 2 1.8 1 0 1st Qur 4th QTER 2nd QTR 3rd QTR Actual Budgeted Previous Yr. LOS BY QUARTER 2020 LOS by Quarter 6 5 5 4.3 4.4 4.5 4 3 2.8 2 1 0 1st Qur 4th QTER 2nd QTR -Actual 3rd QTR -Budgeted Previous Yr. LOS 2020 BY MONTH LOS 6.00 5.00 4.00 3.00 2.00 1.00 0.00 Jan-20 Feb-20 Mar-20 Apr-20 May-20 Aug-20 Sep-20 Oct-20 Nov-20 Dec-20 Jun-20 Jul-20 -LOS 0.00 2.00 4.00 6.00 8.00 10.00 12.00 14.00 16.00 Jan-18 Feb-18 Mar-18 Apr-18 May-18 | Jun-18 Jul-18 Aug-18 Sep-18 Oct-18 Nov-18 Dec-18 LOS 2018-2020 BY MONTH | Jan-19 Feb-19 LOS Mar-19 Apr-19 | May-19 LOS 2 per. Mov. Avg. (LOS) Jun-19 Jul-19 Aug-19 Sep-19 1 1 Oct-19 Nov-19 1 Dec-19 Jan-20 Feb-201 1 1 Mar-20 Apr-20 May-20 Jun-20 Jul-20 Aug-20 Sep-20 Oct-20 | Nov-20 Dec-20 LOS 2018-2020 BY MONTH Visual Paradigm Online Express Edition LOS 2018-2020 UCL 6 +20 5 + lo Www average -1 2 -20 LCL Aug-18 18 Jan-18 Feb-18 Mar-18 Apr 18 May-16 Jun-18 -O-LOS Visual Paradigm Online Express Edition Sep-18 Oct-18 Nov-18 Dec-18 Jan-19 Feb-19 Mar 19 POT-19 May-19 Jaun 2019 Jul 19 Aug-19 Sep-19 Oct-19 Nov-19 Dec 19 -20 Feb-20 Mar-20 Apr-20 May-20 Jun-20 Jul-20 Aug-20 Sep-20 Oct-20 Nov-20 Dec 20Step by Step Solution
There are 3 Steps involved in it
1 Expert Approved Answer
Step: 1 Unlock

Question Has Been Solved by an Expert!
Get step-by-step solutions from verified subject matter experts
Step: 2 Unlock
Step: 3 Unlock