

Question: Describe what you see in the graph below. a. Explain what the variables are in the graph (X and Y axis - what they
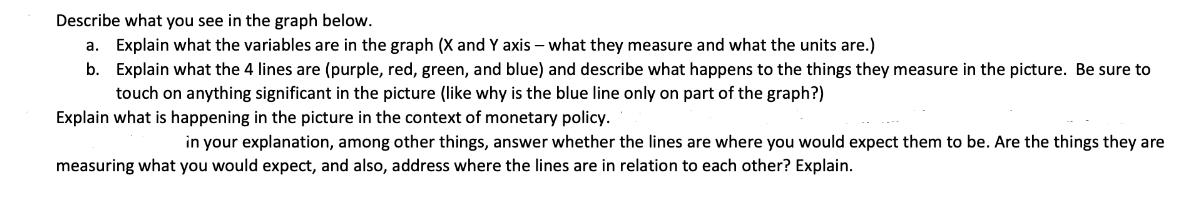
Describe what you see in the graph below. a. Explain what the variables are in the graph (X and Y axis - what they measure and what the units are.) b. Explain what the 4 lines are (purple, red, green, and blue) and describe what happens to the things they measure in the picture. Be sure to touch on anything significant in the picture (like why is the blue line only on part of the graph?) Explain what is happening in the picture in the context of monetary policy. in your explanation, among other things, answer whether the lines are where you would expect them to be. Are the things they are measuring what you would expect, and also, address where the lines are in relation to each other? Explain. FRED Percent, Percent Change from Year Ago Interest Rate on Reserve Balances Federal Funds Target Range - Upper Limit Federal Funds Target Range - Lower Limit Consumer Price Index for All Urban Consumers: All Items in U.S. City Average 2016-01 2016-07 2017-01 Shaded areas indicate U.S. recessions. 2017-07 2018-01 2018-07 2019-01 2019-07 2020-01 Sources: Board of Governors; BLS 2020-07 2021-01 2021-07 2022-01 2022-07 2023-01 fred.stlouisfed.org
Step by Step Solution
There are 3 Steps involved in it
1 The graph shows four lines purple red green and blue plotted against two variables namely interest rate on the yaxis and gross domestic product on t... View full answer

Get step-by-step solutions from verified subject matter experts