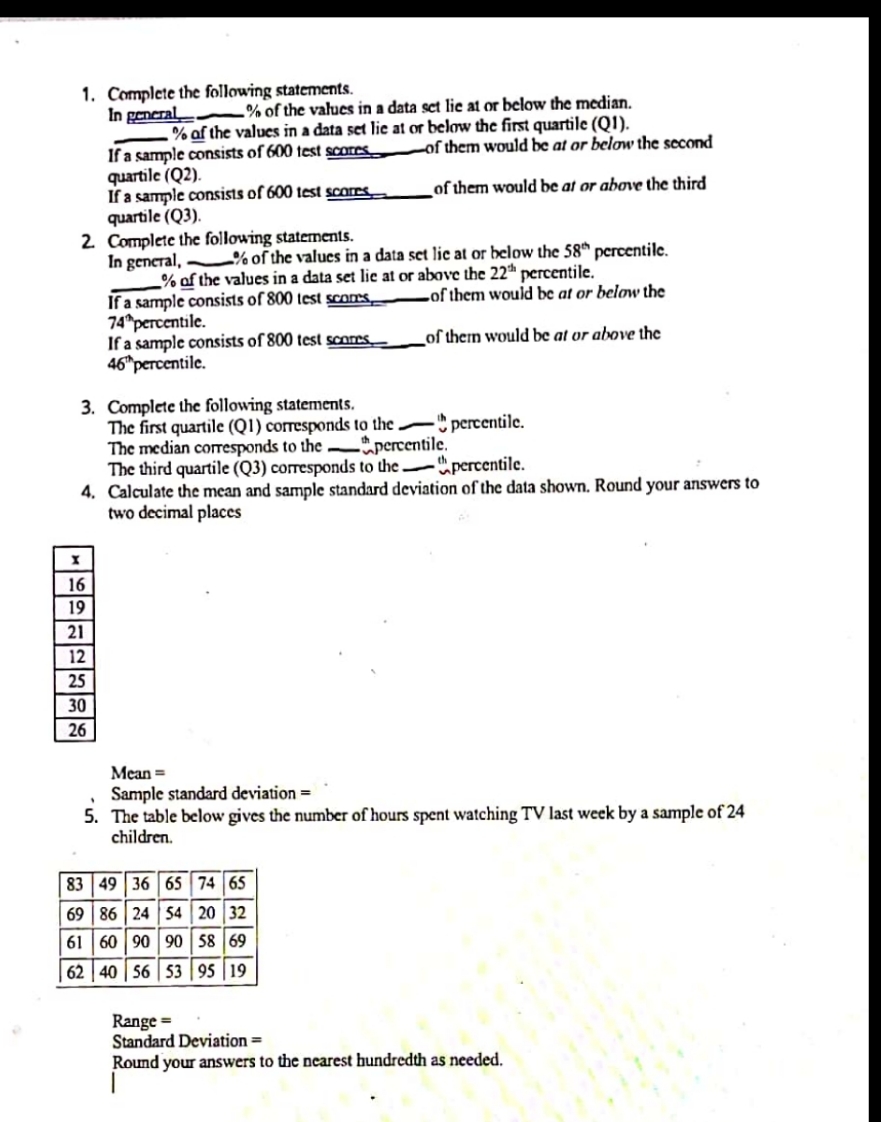
Question: describing data 1. Complete the following statements. In general -% of the values in a data set lie at or below the median. - %

describing data

describing data 1. Complete the following
1. Complete the following statements. In general -% of the values in a data set lie at or below the median. - % of the values in a data set lie at or below the first quartile (Q1). If a sample consists of 600 test scores -of them would be at or below the second quartile (Q2). If a sample consists of 600 test scores of them would be at or above the third quartile (Q3). 2. Complete the following statements. In general, - -% of the values in a data set lic at or below the 58" percentile. % of the values in a data set lie at or above the 22" percentile. If a sample consists of 800 test scoms -of them would be at or below the 74"percentile. If a sample consists of 800 test scores of them would be at or above the 46"percentile. 3. Complete the following statements. The first quartile (Q1) corresponds to the _ percentile. The median corresponds to the -~percentile. The third quartile (Q3) corresponds to the -".percentile. 4. Calculate the mean and sample standard deviation of the data shown. Round your answers to two decimal places 16 19 21 12 25 30 26 Mean = Sample standard deviation = 5. The table below gives the number of hours spent watching TV last week by a sample of 24 children. 83 49 36 65 74 65 69 86 24 54 20 32 61 60 90 90 58 69 62 40 56 53 95 19 Range = Standard Deviation = Round your answers to the nearest hundredth as needed

Step by Step Solution

There are 3 Steps involved in it

1 Expert Approved Answer
Step: 1 Unlock blur-text-image
Question Has Been Solved by an Expert!

Get step-by-step solutions from verified subject matter experts

Step: 2 Unlock
Step: 3 Unlock

Students Have Also Explored These Related Mathematics Questions!