

Question: Describing Histograms The data file Nurses Experience Histogram contains data on the number of years of job experience for a random sample of 243 nurses.
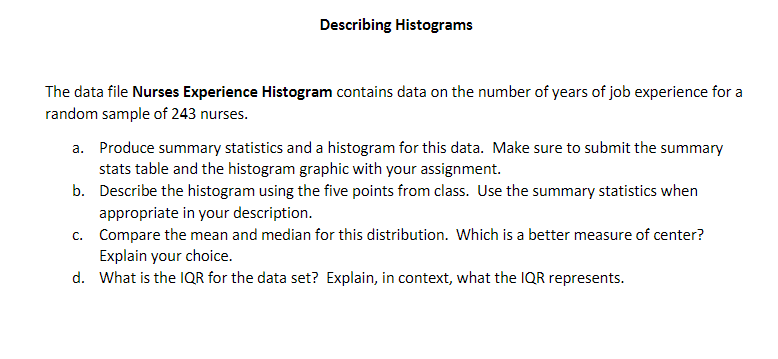


Describing Histograms The data file Nurses Experience Histogram contains data on the number of years of job experience for a random sample of 243 nurses. a. Produce summary statistics and a histogram for this data. Make sure to submit the summary stats table and the histogram graphic with your assignment. b. Describe the histogram using the five points from class. Use the summary statistics when appropriate in your description. c. Compare the mean and median for this distribution. Which is a better measure of center? Explain your choice. d. What is the IQR for the data set? Explain, in context, what the IQR represents.Options var6 var / var8 var9 vario var11 X var12 var13 Frequency 50 Options Summary statistics: Column n Mean Variance Std. dev. Std. err. Median Range Min Max Q3 Q1 Sum IQR Years 243 16.934156 188.17953 13.717854 0.88000077 12 50 0 50 31 5 4115 26 40 30 20 10 10 20 30 40 50 E Years
Step by Step Solution
There are 3 Steps involved in it

Get step-by-step solutions from verified subject matter experts