

Question: Description Read instructions carefully, construct your Excel worksheet, summarize your work in Word, and upload both your files (Word and Excel). Your summary must be
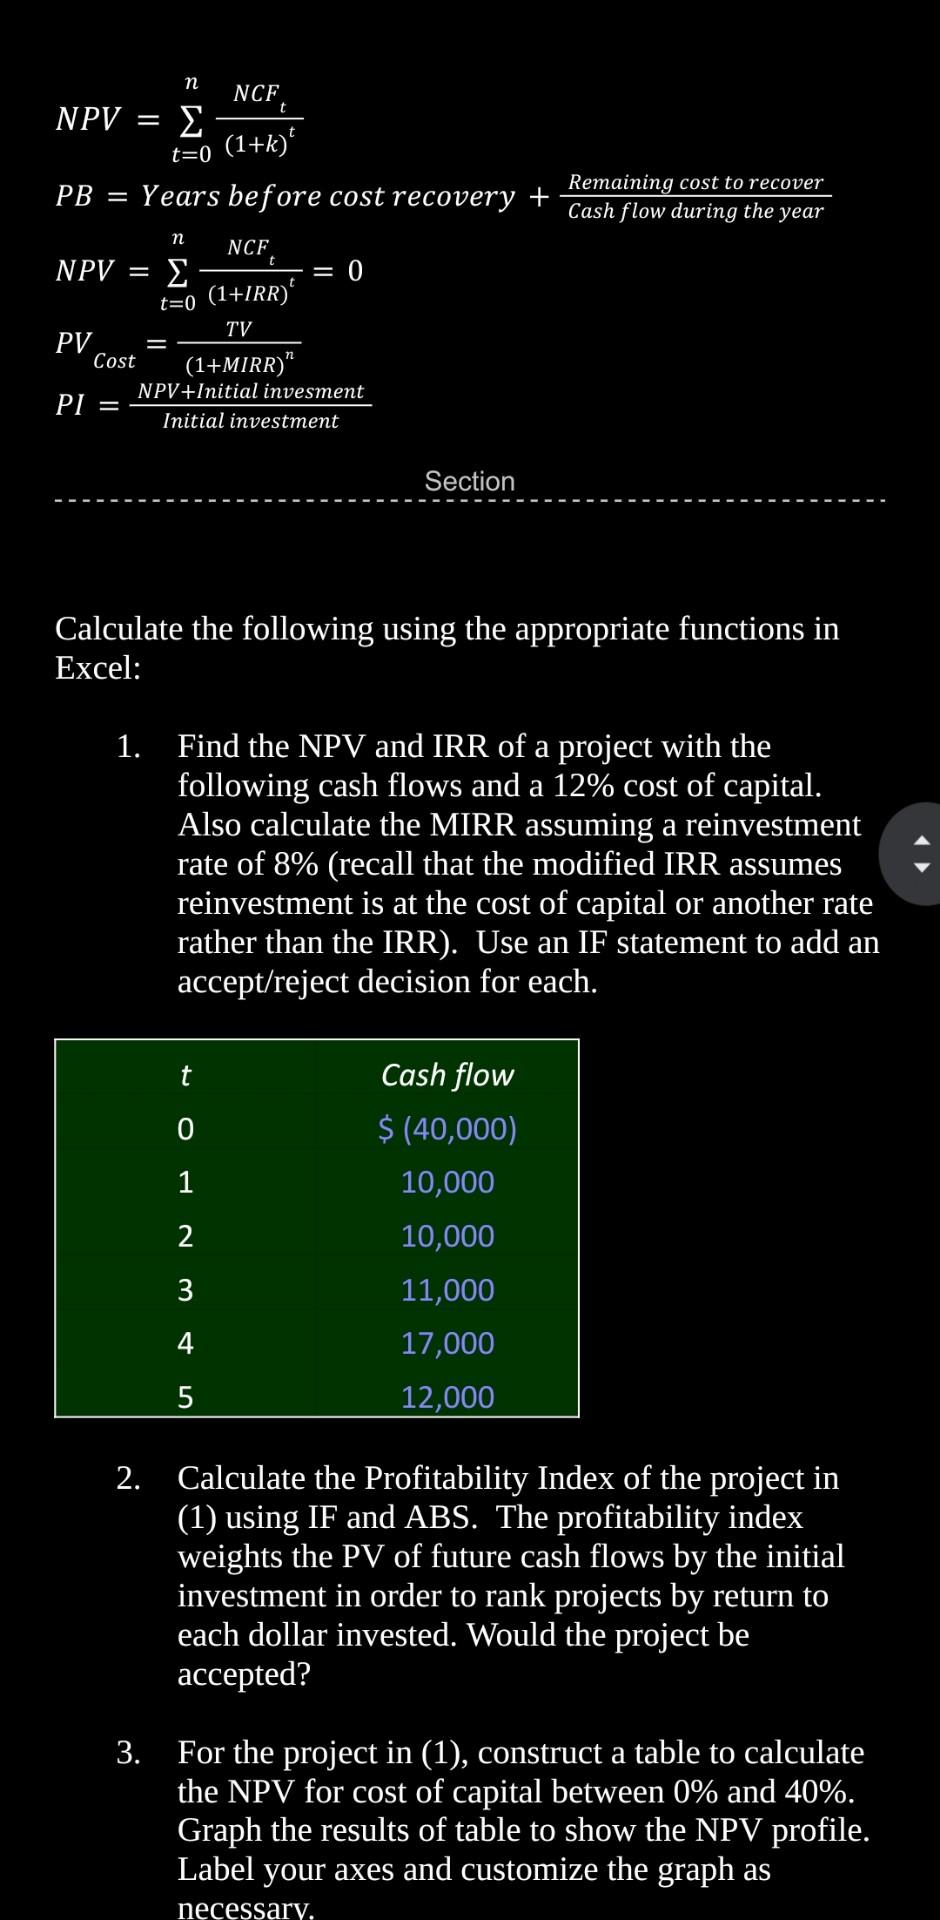
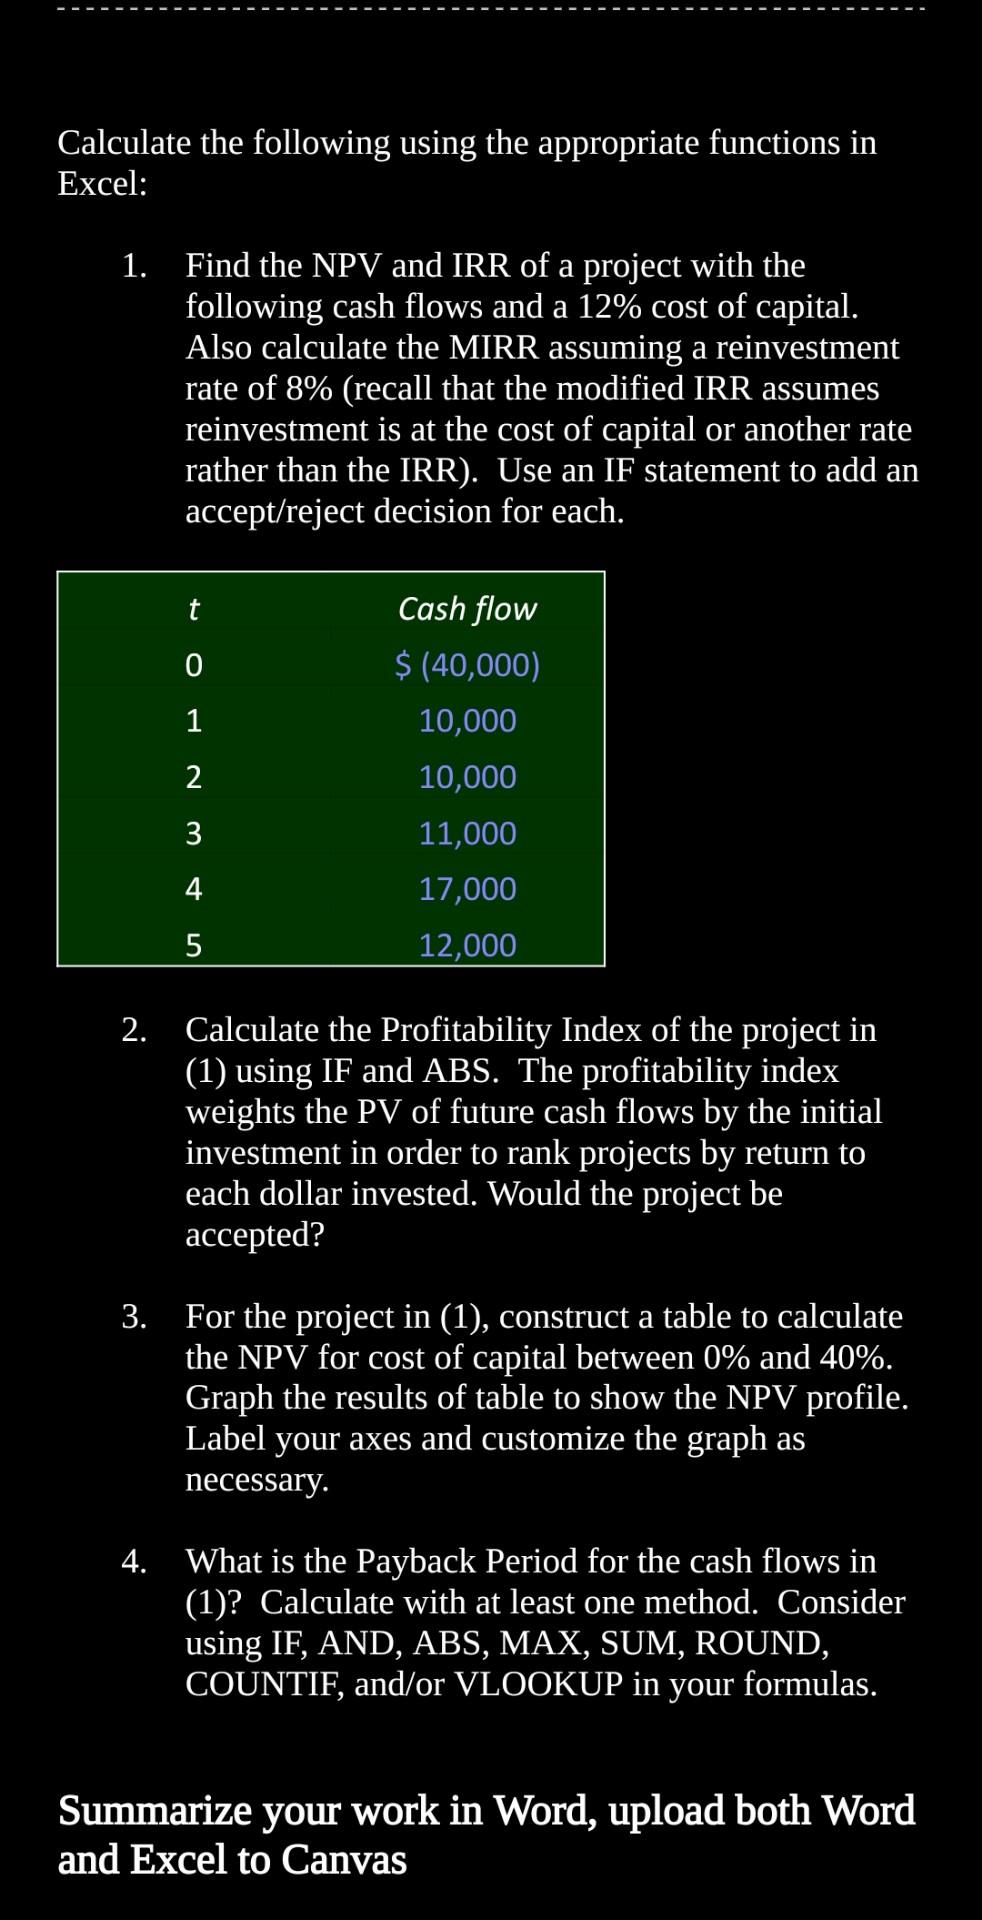
Description Read instructions carefully, construct your Excel worksheet, summarize your work in Word, and upload both your files (Word and Excel). Your summary must be less than one page. Word and Excel are free through CSUN: https://www.csun.edu/it/microsoft-office n = (1+k) n NCF t NPV t=0 PB Years before cost recovery Remaining cost to recover + Cash flow during the year NCF NPV = 0 t=0 (1+IRR)" TV PV Cost (1+MIRR)" NPV +Initial invesment PI Initial investment t Section Calculate the following using the appropriate functions in Excel: 1. Find the NPV and IRR of a project with the following cash flows and a 12% cost of capital. Also calculate the MIRR assuming a reinvestment rate of 8% (recall that the modified IRR assumes reinvestment is at the cost of capital or another rate rather than the IRR). Use an IF statement to add an accept/reject decision for each. t 0 1 2 Cash flow $ (40,000) 10,000 10,000 11,000 17,000 12,000 3 4 5 2. Calculate the Profitability Index of the project in (1) using IF and ABS. The profitability index weights the PV of future cash flows by the initial investment in order to rank projects by return to each dollar invested. Would the project be accepted? 3. For the project in (1), construct a table to calculate the NPV for cost of capital between 0% and 40%. Graph the results of table to show the NPV profile. Label your axes and customize the graph as necessary. Calculate the following using the appropriate functions in Excel: 1. Find the NPV and IRR of a project with the following cash flows and a 12% cost of capital. Also calculate the MIRR assuming a reinvestment rate of 8% (recall that the modified IRR assumes reinvestment is at the cost of capital or another rate rather than the IRR). Use an IF statement to add an accept/reject decision for each. t 1 A W NPO + 2 Cash flow $ (40,000) 10,000 10,000 11,000 17,000 12,000 3 4 5 2. Calculate the Profitability Index of the project in (1) using IF and ABS. The profitability index weights the PV of future cash flows by the initial investment in order to rank projects by return to each dollar invested. Would the project be accepted? a 3. For the project in (1), construct a table to calculate the NPV for cost of capital between 0% and 40%. Graph the results of table to show the NPV profile. Label your axes and customize the graph as necessary. 4. What is the Payback Period for the cash flows in (1)? Calculate with at least one method. Consider using IF, AND, ABS, MAX, SUM, ROUND, COUNTIF, and/or VLOOKUP in your formulas. Summarize your work in Word, upload both Word and Excel to Canvas Description Read instructions carefully, construct your Excel worksheet, summarize your work in Word, and upload both your files (Word and Excel). Your summary must be less than one page. Word and Excel are free through CSUN: https://www.csun.edu/it/microsoft-office n = (1+k) n NCF t NPV t=0 PB Years before cost recovery Remaining cost to recover + Cash flow during the year NCF NPV = 0 t=0 (1+IRR)" TV PV Cost (1+MIRR)" NPV +Initial invesment PI Initial investment t Section Calculate the following using the appropriate functions in Excel: 1. Find the NPV and IRR of a project with the following cash flows and a 12% cost of capital. Also calculate the MIRR assuming a reinvestment rate of 8% (recall that the modified IRR assumes reinvestment is at the cost of capital or another rate rather than the IRR). Use an IF statement to add an accept/reject decision for each. t 0 1 2 Cash flow $ (40,000) 10,000 10,000 11,000 17,000 12,000 3 4 5 2. Calculate the Profitability Index of the project in (1) using IF and ABS. The profitability index weights the PV of future cash flows by the initial investment in order to rank projects by return to each dollar invested. Would the project be accepted? 3. For the project in (1), construct a table to calculate the NPV for cost of capital between 0% and 40%. Graph the results of table to show the NPV profile. Label your axes and customize the graph as necessary. Calculate the following using the appropriate functions in Excel: 1. Find the NPV and IRR of a project with the following cash flows and a 12% cost of capital. Also calculate the MIRR assuming a reinvestment rate of 8% (recall that the modified IRR assumes reinvestment is at the cost of capital or another rate rather than the IRR). Use an IF statement to add an accept/reject decision for each. t 1 A W NPO + 2 Cash flow $ (40,000) 10,000 10,000 11,000 17,000 12,000 3 4 5 2. Calculate the Profitability Index of the project in (1) using IF and ABS. The profitability index weights the PV of future cash flows by the initial investment in order to rank projects by return to each dollar invested. Would the project be accepted? a 3. For the project in (1), construct a table to calculate the NPV for cost of capital between 0% and 40%. Graph the results of table to show the NPV profile. Label your axes and customize the graph as necessary. 4. What is the Payback Period for the cash flows in (1)? Calculate with at least one method. Consider using IF, AND, ABS, MAX, SUM, ROUND, COUNTIF, and/or VLOOKUP in your formulas. Summarize your work in Word, upload both Word and Excel to Canvas
Step by Step Solution
There are 3 Steps involved in it

Get step-by-step solutions from verified subject matter experts